Download Worksheet "Constructing a Frequency Distribution?" as rtf-file for use in class
Subjects:
Mathematics and all other subjectsType of Exercise:
The exercise is suitable to be used- in class to be solved by each student individually
- in class to be solved in small groups of 2-3 students
- as homework
Objectives:
- analysing data
- practising analytical skills
- construction of a frequency distribution graph
- basic operations with Excel (if you do not want to use Excel the students can be asked to draw the graph)
Prerequisite:
- Chapter 2.1: The Frequency Distribution
- The students should be familiar with the following terms: discrete data, continous data, frequency distribution
- If the students are already familiar with Excel, they should be fine. Additional help with importing data from text files is given in Material 2
- If the students are not familiar with Excel 97, a short introduction will be needed (Material 3).
Materials:
- Textfile with data: datafile_dice.txt (essential)
- Tutorial How to import text files into Excel (optional)
- Tutorial How to draw a histogram in Excel (optional)
Time needed:
1-2 school lessons, depending on the students' previous knowledge in working with Excel
Solution:
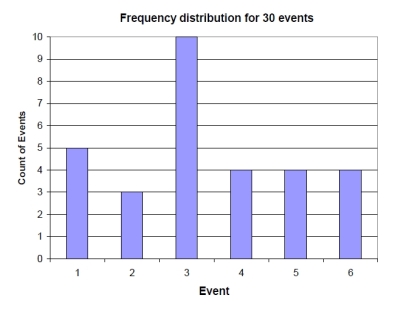
The data ranges from 1 to 6, this determines the number of columns on the x-axis.
The distribution of the data is as follows.
| Event | Count |
|---|---|
| 1 | 5 |
| 2 | 3 |
| 3 | 10 |
| 4 | 4 |
| 5 | 4 |
| 6 | 4 |
| Total | 30 |
The largest count of events is 10. The range of the Y-axis is therefore from 1 to 10.
This is what the histogram showing the frequency distribution of events should look like.
Download Worksheet "Constructing a Frequency Distribution?" as rtf-file for use in class
