2. Introduction into the Mathematical Methods
The relative frequency distribution
Consider the two frequency distributions for single training areas shown in the satellite image and depicted below. What is the problem with using them for comparison purposes? The frequency counts on the vertical axis are very different; it is difficult to compare them. The solution is to convert them into relative frequency distributions. You do this by finding the total count of all columns or bins, and divide each count by this total count value.
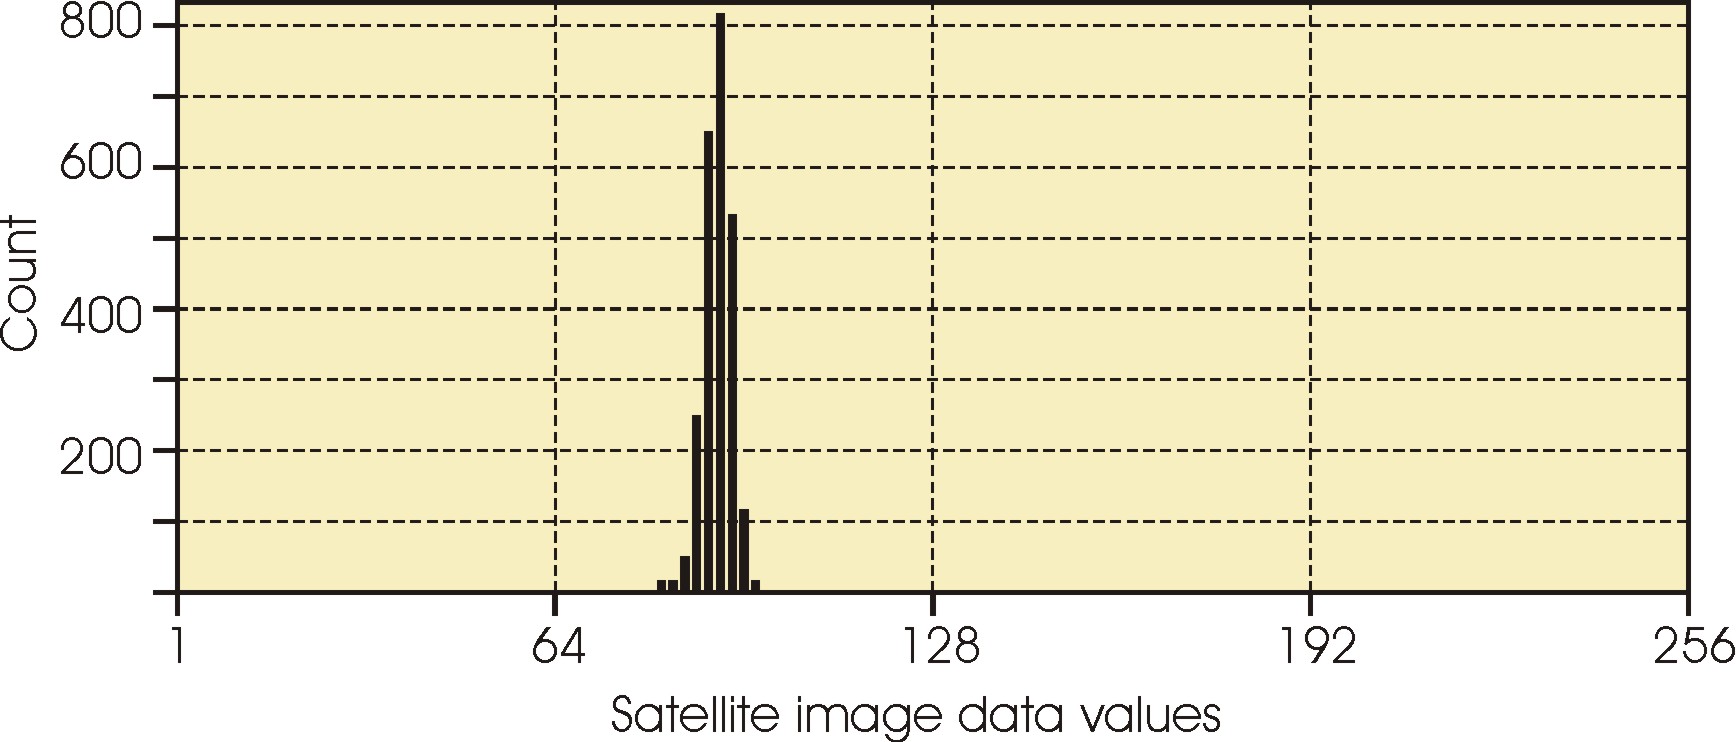
A frequency distribution for one training area on one cover type
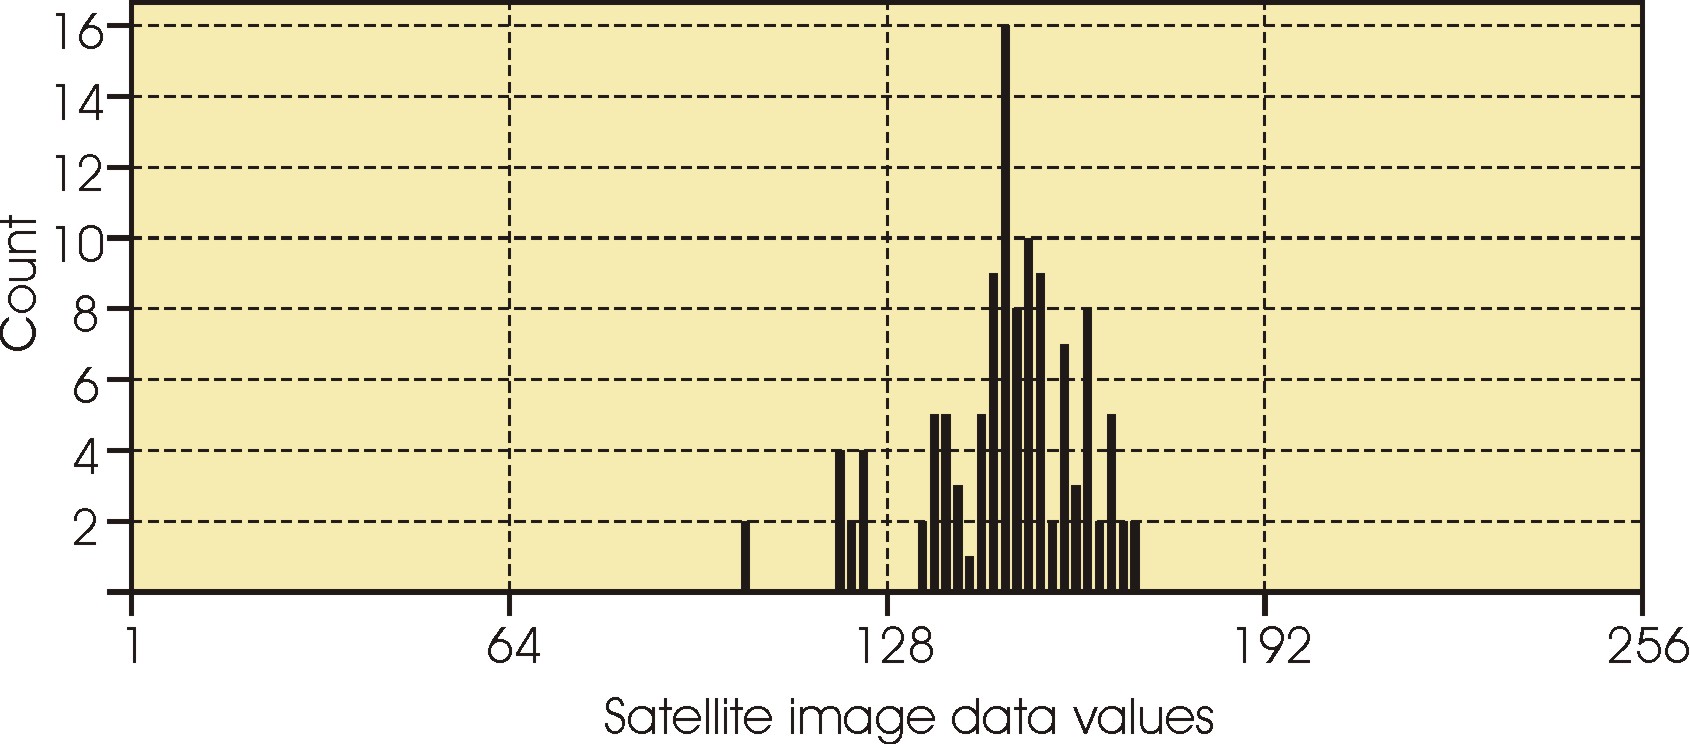
A frequency distribution for one training area on another cover type
The third graph below shows relative frequency distributions for one waveband of the whole of the Skagen image as well as for the three training areas shown in the image, in which the columns are replaced with a single line.

Frequency distributions for the whole of the Skagen image and for the three training areas.
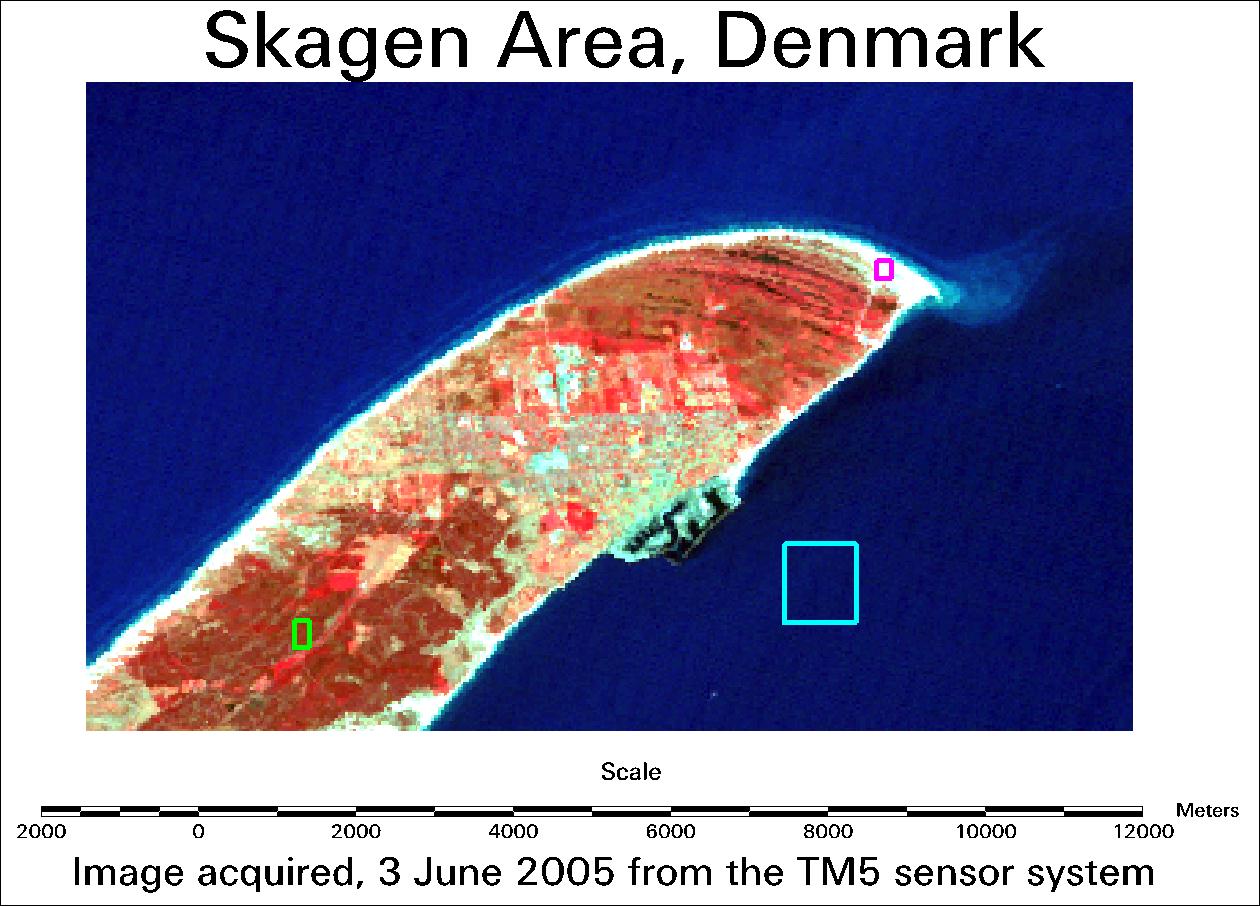
This image is of the Skagen area of Denmark as seen by a satellite image acquired on 3rd June 2004,
with bands three different bands shown in blue, green and red, with three sample areas for water( cyan),
Conifer Plantations (green) and sand (red).
Image source: USGS
Image source: USGS
Questions:
- The Relative Frequency Distribution or histogram for the whole image has three peaks, whilst those for sand and water do not.
Why is this?
- The histogram for plantation does not either. Why not?
- What cover types are represented in the three peaks in the histogram for the whole image?
