2. Introduction into the Mathematical Methods
Measure of value
Sometimes you want a single value to represent your data. What is it best to use?
There are three values that you can choose from
- The Mean
- The Mode
- The Median
If a set of observations are given by where each is an individual observation, then the Mean is given by the equation:
Note that the sample mean uses the symbol, called x bar. This equation can be described as the sum of the individual n observations in the sample divided by the number of observations. A short hand for the sum of observations is the Greek (sigma) symbol, where the letter below the sigma indicates the parameter in the summation that will change, in this example i in the sequence . The values below and above the sigma indicate the first and last values allocated to this parameter, so that:
A variation on this is when your data is in a frequency distribution. Each bin in the frequency distribution gives the number of occurrences of that value, or the number of observations in that bin. Given this, then the mean is calculated as the sum of the product of the bin values by the bin counts and divided by the sum of the bin counts.
Thus for grouped data:
Where and are the histogram count and value in bin i.
The Mode is the value that occurs most frequently in a set of data, whilst the Median separates the higher half of a sample from the lower half. It is the middle value between the highest and lowest values in a set of data. If there is an even number of values in the data set, as is the case with, for example, a dice, then the Median is taken as being midway between them, or 3.5 with a dice.
For example: Assume this to be a data set as a result of a dice experiment:
1, 3, 5, 2, 4, 4, 1, 6, 1
Now, the Mode of this data set is 1 as this value occures three times, while all other possible values occure only two or one time.
The Median of this experiment is
The Mean of our experiment is
Questions
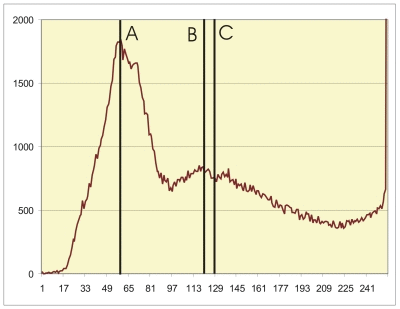
- In the histogram above, the mean, median and mode are all marked as lines, with symbols (A), (B) and (C) against
the lines. Which line represents the mean, the mode and the median?
- We have discussed here the sample mean,
.
What is the population mean, µ, and does the population mean vary from the sample mean and if so, why? Clue - you should look up the definitions of sample and population in the Glossary.

