2. Introduction into the Mathematical Methods
The binomial distribution (1/2)
The binomial distribution is a discrete probability distribution that can be used with experiments or activities that have four properties:
- The event or experiment consists of a sequence of n identical trials, such as occurs in throwing a dice.
- Only two outcomes are possible from each trial, usually called a success and a failure. The sum of the probabilities associated with the success and the failure must be 1.
- The probability of success does not change from trial to trial.
- The trials are independent.
An example of a binomial experiment might be eight tosses of a coin, yielding the results; (H, T, H, H, H, T, H, H) (for "Head" and "Tail").
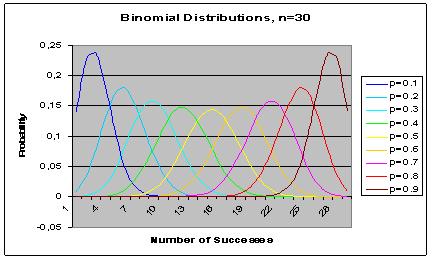
The aim of the binomial experiment is usually concerned with the number of successes that are likely to occur in n trials. Thus the question posed might be; “What is the probability of x successes in n trials?” In this type of experiment, x is a discrete number, and so this type of experiment yields a discrete Probability Density Function.
Consider the question, "What is the probability of 6 heads from 8 tosses of coin?" where we might have tossed a coin eight times and got the result given above. The first question to be addressed is, "Is this an appropriate question for use of the Binomial Distribution?"
- Are all of the trials in the sequence of an identical type? - Yes, each trial is a toss of a coin, or in the case of a dice, in the toss of the dice
- Are there only two possible outcomes? - Yes. With a coin the probability of success in each trial is 0.5, because the toss will produce either a head or a tail. With a dice, there are six possible outcomes, but if the question concerns the probability of getting 6 sixes in eight trials, then the probability of success in an individual trial is the probability of getting a six in that trial, that is 1/6.
- Is the probability of success the same for each trial? - Yes
- Are the trials independent? - Yes

