What's on the sea floor?
Case study - A bottom-type classification near Jebel Ali in the southern Arabian Gulf
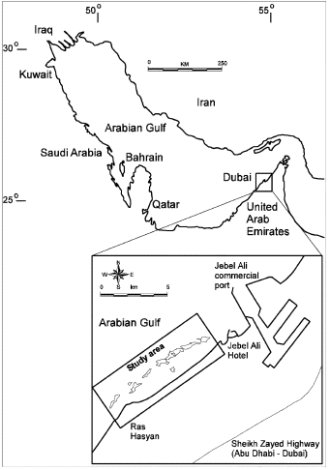
Study area
The coastal area near Jebel Ali is a marine protected area,
which means that there is a certain level of restriction to protect, in this case, coral reefs and their environment.
It is situated between Abu Dhabi and Dubai in the United Arab Emirates in the south-eastern Arabian Gulf.
Used sensor
To monitor the complexity of the coral-reef environment near Jebel Ali an IKONOS sensor is used, with a superior spatial resolution of 4 m (one pixel on the IKONOS image represents 4 m2 in real).
Classification
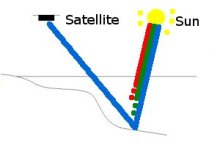
To classify the different bottom-types, the spectral reflectance of the different bands in the sensor need to be analysed.
In this classification, a distinction was made between two different zones. In each zone different bands give maximum spectral information.
- In a shallow zone (< 3,5 m) three bands (blue, green and red) were used to classify.
- The segment beyond 3,5 m was classified using only the first two visible bands (blue and green).
Question: Do you know why they made this distinction?
TIP: you can find the answer in the chapter "How deep is the sea?"

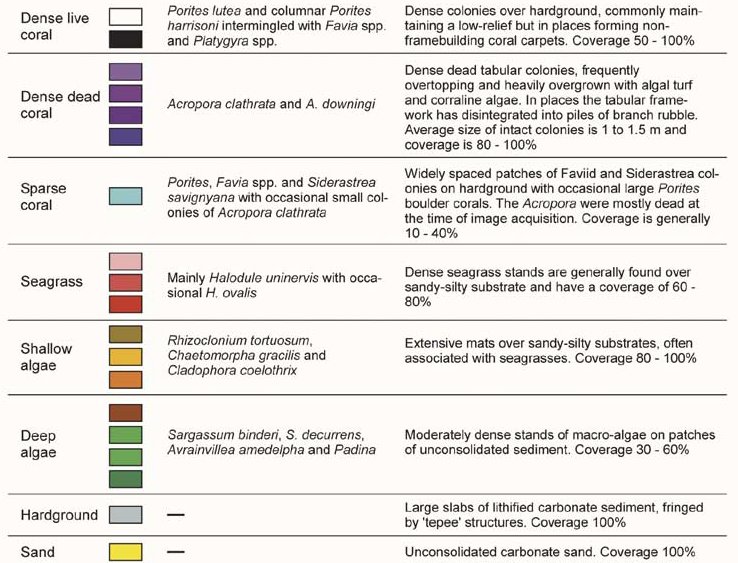
The classification resulted in 22 substrate classes that were sufficient to encompass the sedimentary and biotic diversity of the area. Those 22 classes could be collapsed into eight broad groups.
Verification is needed!
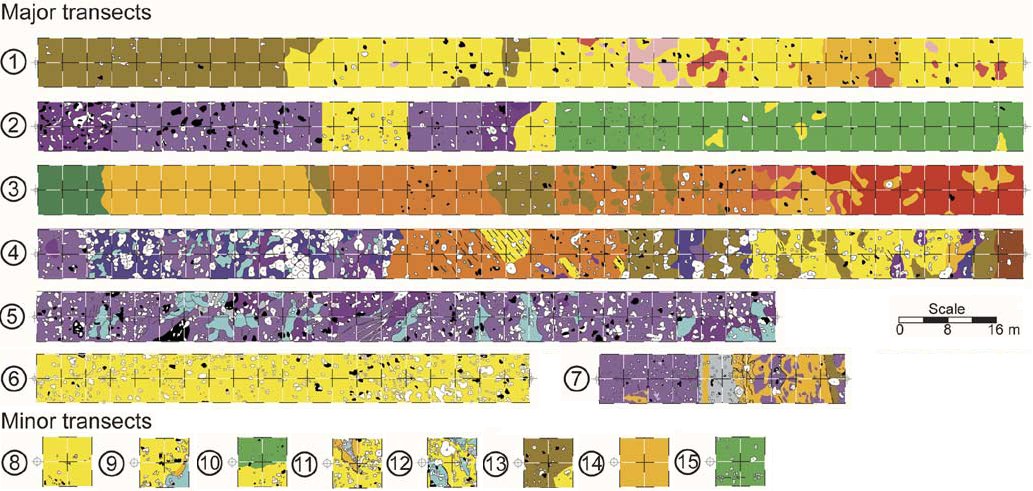
A combination of point and continuous data were collected to maximize the statistical validity of the assessment.
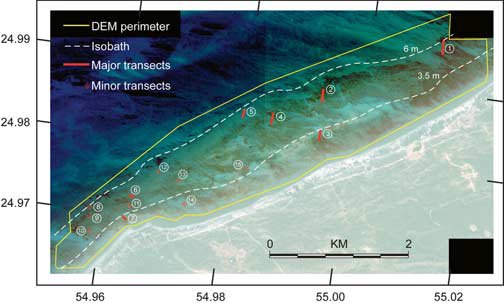
- Without any a priori knowledge of substrate distribution, 52 spot-checks were dived from the boat at semiregular intervals across the study area. With a team of four scuba divers working in unison, on transect of typical dimensions 160 x 8 m (equivalent to 80 IKONOS pixels) could be mapped per day.
- The location of 15 transects were predetermined on the imagery. The transects were distributed at various locations from the shore, in differing water depths and orientated differently with respect to north.
- The mapped sheets were scanned and digitized.