1. Light and Radiation

Spectral analysis: Colour glass filters    (2/4)

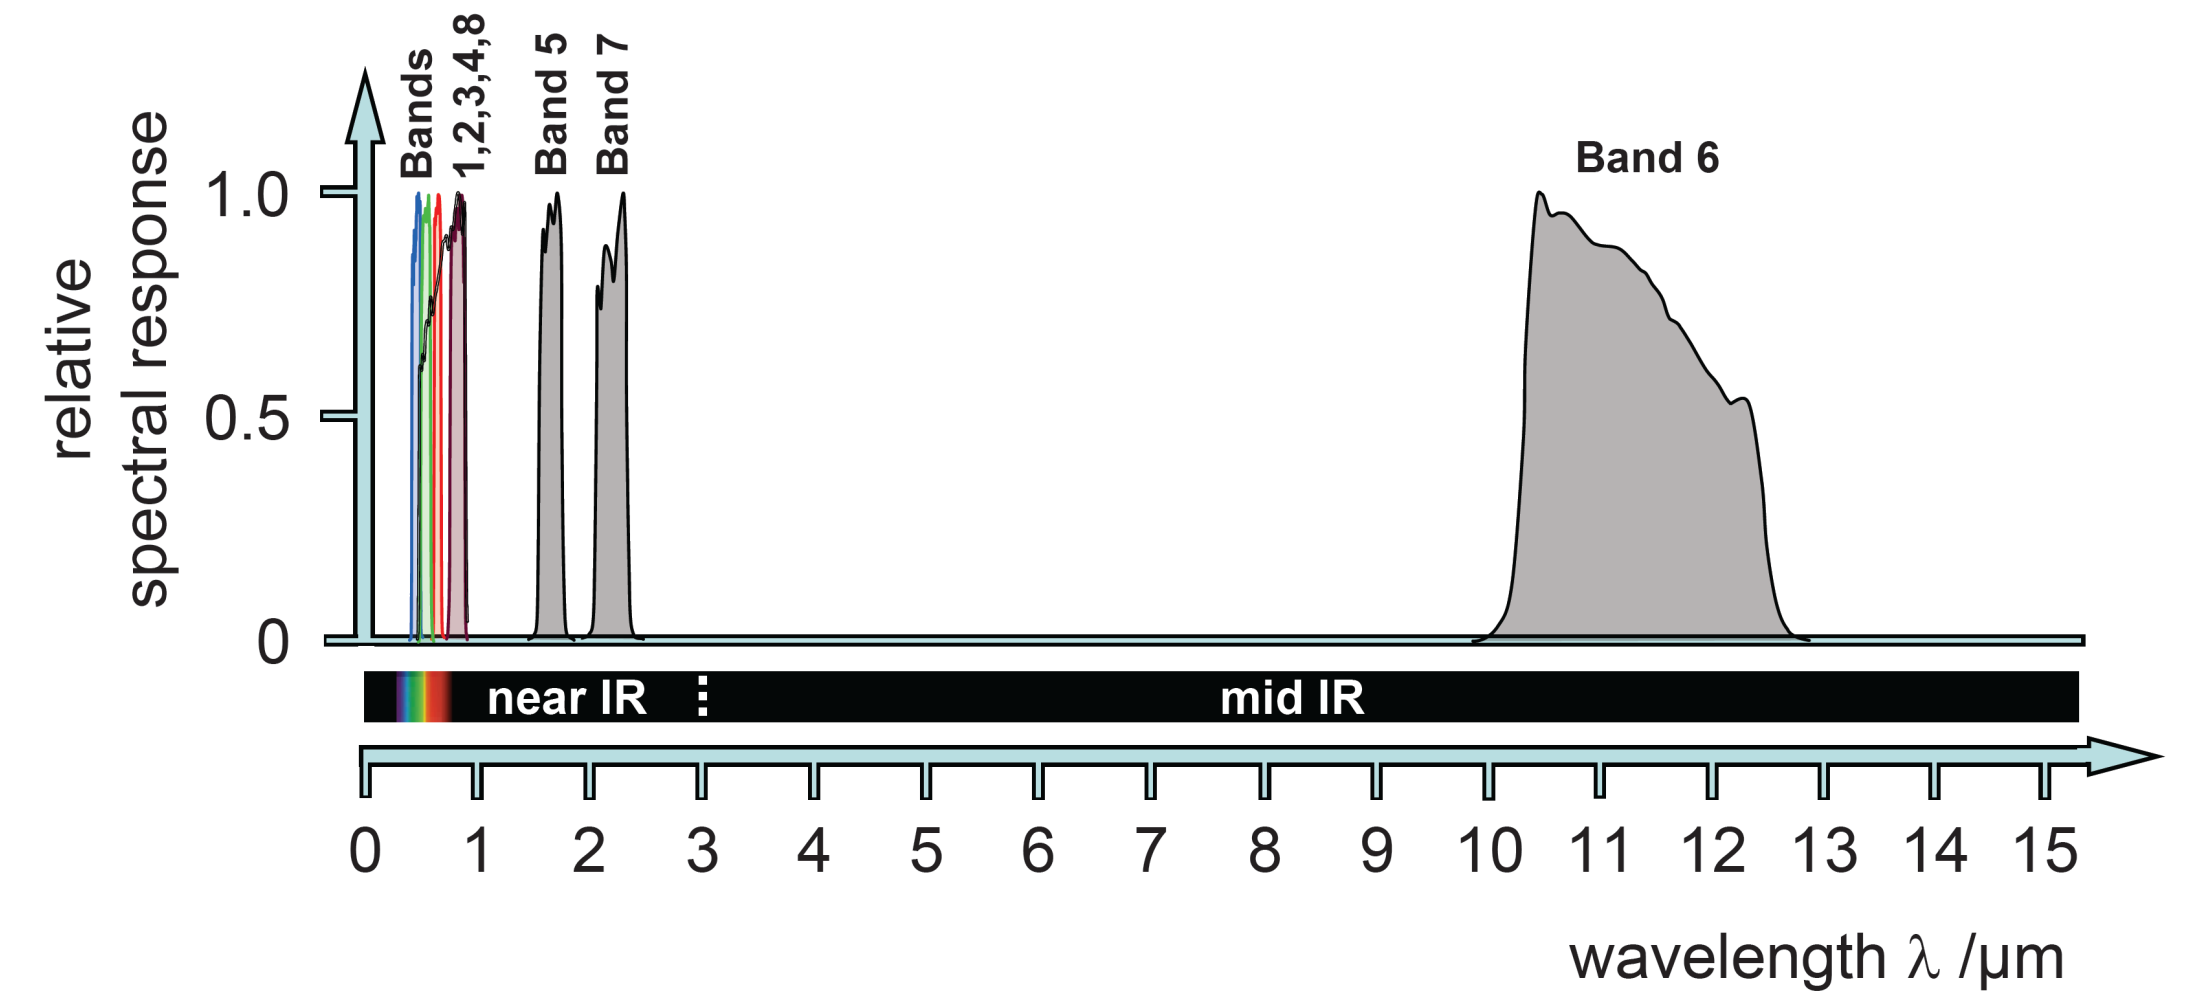
The Thematic Mapper (TM) aboard the Landsat 5 satellite uses optical filters to take multispectral imagery.


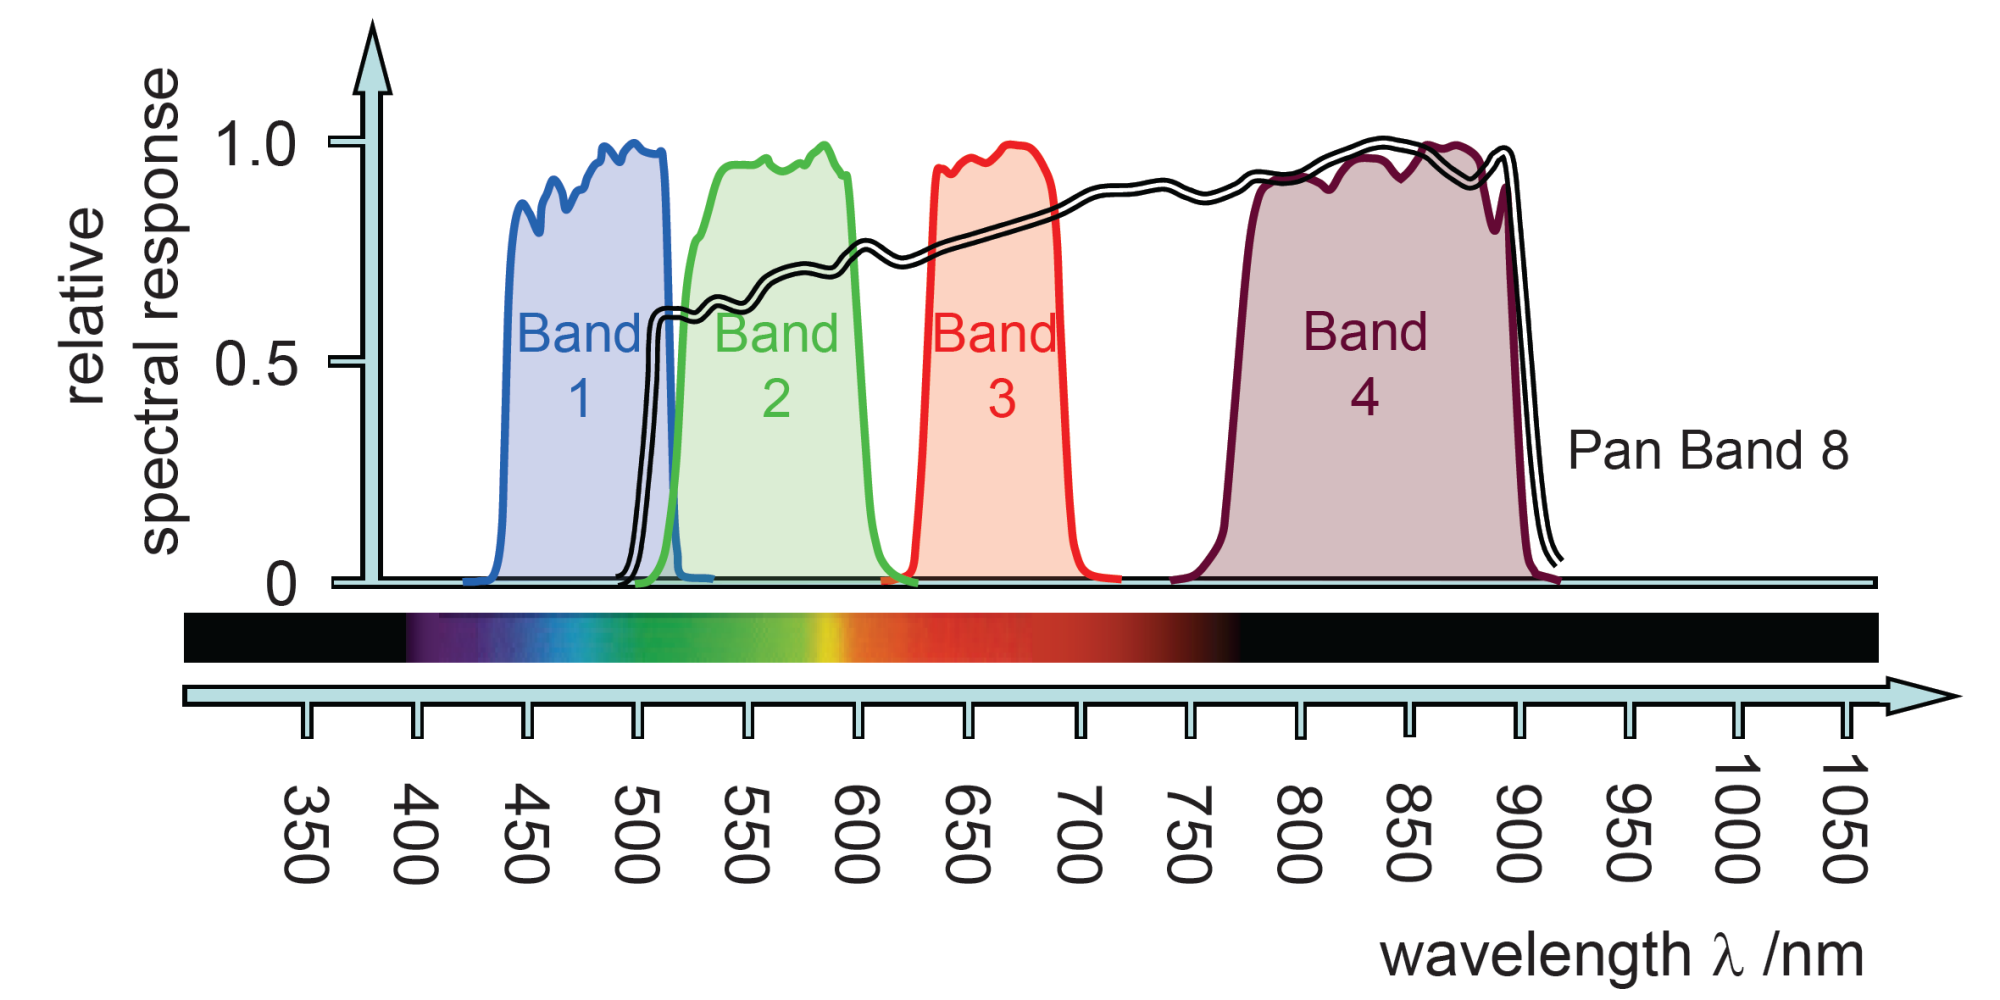
The transmission of the TM Bands is depicted in the following graphs. For a better comparison the curves are normalised to unity.

The processing of TM images is depicted with a sample image of central Italy and the region around Rome. Geographical information and image metadata are available here.

Click on the links under the column TM band to open black-and-white images taken in the respective bands with a reduced ground resolution of 180 m in bands 1 to 7 and 90 m in band 8.


Landsat 7 Thematic Mapper bands and their characteristics

TM band Wavelength Spectral range Signal type Ground resolution Characteristics
1 0.45-0.52 μm blue-green reflective 30 m mapping of coastal waters; discrimination of soil, vegetation and man-made features; forest classification
2 0.52-0.60 μm green-yellow reflective 30 m classification of vegetation and man-made features
3 0.63-0.69 μm red reflective 30 m identification of plant species and of man-made features
4 0.76-0.90 μm near-IR reflective 30 m soil moisture measurement; discrimination of water and land
5 1.55-1.75 μm mid-IR reflective 30 m measurement of vegetation moisture content
6 10.40-12.50 μm thermal IR emissive 60 m measurement of earth surface temperature; identification of vegetation stress; measurement of soil moisture; cloud classification; monitoring of volcanic activity
7 2.08-2.35 μm mid-IR reflective 30 m discrimination of rocks; measurement of soil moisture
8 0.59-0.90 μm panchromatic reflective 15 m mapping with high geometric resolution