2. Thermal Radiation
Absorption and emission: Kirchhoff's radiation law (4/4)
Temperature images
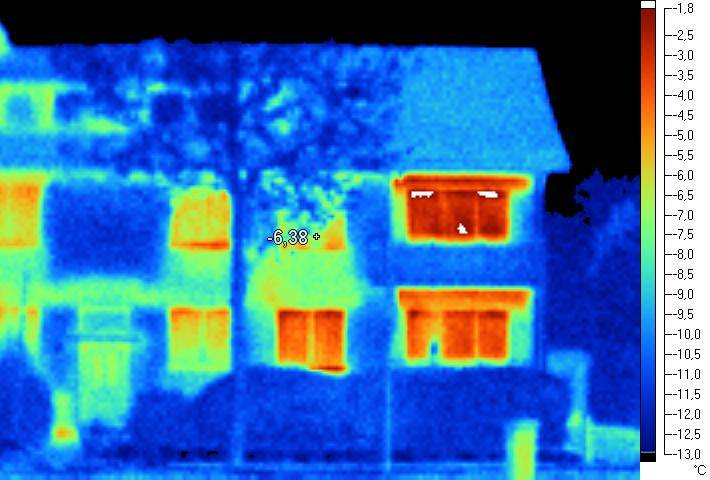
It is possible to match the different shades of grey in infrared images with temperatures. Different temperatures may be indicated as a colour scale. In this way colour coded temperature images are obtained. In most cases blue is used to indicate a lower temperature whereas red indicates a higher one. This is used in thermography of buildings in order to identify thermal leaks in walls and windows.
The thermal images in the left column were taken with a Fluke® Ti10 infrared camera. The spectral range of its detector is between 7.5 and 14 μm.
Mid left: Photograph of the badly isolated building.
Mid right: Thermal image of a better isolated building. Windows are thermal bridges here as well. The gable wall has a slightly elevated temperature due to sunlight from the right side.
Right: Photograph of the better isolated building.
Date of recording: 17 Jan 2017 11 o'clock, air temperature -12°C. The sky appears black; its radiation temperature was -30°C, well below the used scale in these images.
Polished metals have a low degree of emission. Therefore their degree of absorption is also low, and they reflect the radiation emitted by the environment instead. The next image shows and example.
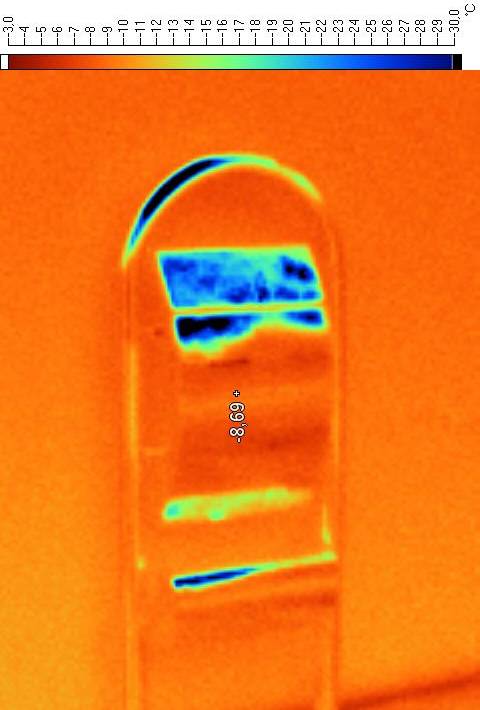
Right: Photograph of the mailbox.
Date of recording: 17 Jan 2017 11 o'clock. The air temperature was -12°C, and presumably this was also the true temperature of the mailbox.
It is possible to obtain thermal images from regions in different seasons by the help of a research aircraft to make the temperature differences of objects in the course of one year visible.

Source: DLR.

Source: DLR.
For photographs from space, there are even more effects influencing the measured brightness which have to be taken into account. These can be:
- signal contributions which result from sun glitter on the ground and from scattering of sunlight by particles in the atmosphere,
- the partial absorption of the thermal radiation emitted by the ground by absorbing gases in the atmosphere,
- the impact of the angle of view on the degree of emission of matter.
Many satellites measure the land surface temperature (LST) and the sea surface temperature (SST). Links to providers of these data are given on the link page of this section.
In the next section it will be explained what laws the emission of a hot body obey during the process of cooling down when emission shifts from the visible to the thermal infrared. On top of that there will be a closer look on further details of the spectral characteristics of this emission.
