3. المناخ وتغير المناخ
The climate crisis (3/3)
Global mean temperatures since 1880
As a result of increasing greenhouse gases in the atmosphere, the greenhouse effect continues to increase. The temperatures of the Earth's surface are rising accordingly. How has this developed since the beginning of globally available temperature measurements?

Changes in temperature at the Earth's surface (land and oceans) since 1880. The graph ends in 2023 and is updated annually. The black squares represent the annual averages. The red curve (lowess smoothing) shows a moving average. The light gray band behind the curves corresponds to the uncertainty of the data. LSAT is the Land Surface Air Temperature, SST is the Sea Surface Temperature.
Source: NASA Goddard Institute for Space Studies, USA.
The graphics shown on this page are the results of climate researchers at the NASA Goddard Institute for Space Studies, USA. They are published on https://data.giss.nasa.gov/gistemp/ and continuously updated.
The average temperature of the entire Earth's surface was 14°C in the climatological base period from 1951 to 1980. In climate research, this is used as a reference temperature and set to zero. Deviations from zero are referred to as temperature anomalies. This explains the temperature axes in the graphs shown.
The cause of the low variability between 1951 and 1980 is not fully understood. One possible cause is considered to be increasing air pollution, which is why the backscattering of solar radiation into space increased and less radiation reached the Earth's surface. From the mid-1960s, regulations on the emission of pollutants were enacted and air quality subsequently improved. Temperatures rose again.
The politically agreed target of limiting the increase in temperature to a maximum of 2°C hardly seems achievable any more. Climate research assumes that temperatures will actually rise by 3 to 4°C by the end of this century.
Regional temperature anomalies
Global development is important for the Earth's climate as a whole. This can vary greatly from region to region. This is also usually very variable over time. There are areas where temperatures are temporarily lower than in the base period and other areas where they are extremely higher. The following graphic shows a snapshot of the temperatures in July 2023.
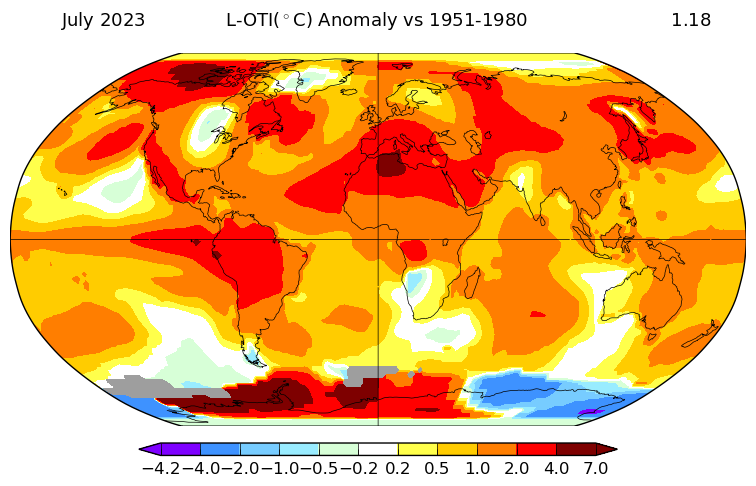
Regional temperatures in July 2023 compared to the average in the base period 1951 to 1980. The global average is 1.18°C higher than in the base period. L-OTI is the Land - Ocean Temperature Index. It uses the air temperature over land and sea ice and the water temperature in ice-free areas.
Source: NASA Goddard Institute for Space Studies, USA.
In August 2023, an extreme melting of the permafrost on the Arctic coast of Canada was reported, which is explained in the map: in July 2023, the temperature in this region is 7°C higher than in the base period.
As a result of this global crisis, more and more people are fleeing from regions where they can no longer find a livelihood to countries that have not yet been affected to the same extent. This climate-induced migration is also leading to profound social and economic crises.
These consequences cannot be discussed in detail here. The aim of the learning unit is to present the physical relationships that have led to the climate crisis and continue to drive it forward today, and to make their causes understandable.
