4. Absorption et diffusion
Photométrie d'absorption (6/6)
Spectres d'absorption dans des environnements naturels
Toutes les matières absorbantes dans la nature sont composées de différentes molécules. Les chlorophylles illustrées ci-dessus ne sont qu'une petite sélection de pigments végétaux qui peuvent être chimiquement isolés et identifiés
Dans la plupart des cas, des informations sommaires sur ces pigments sont suffisantes pour définir la quantité et l'état de la végétation, pour prévoir les récoltes ou pour surveiller les forêts et les champs d'algues dans les océans. L'obtention de ces informations à partir de satellites dans l'espace est un avantage particulier lorsqu'il s'agit de décrire la végétation dans de vastes zones de la terre. Ces données représentatives ne pourraient pas être obtenues à partir de mesures effectuées au sol. La façon dont les satellites rendent cela possible est expliquée dans les sections Télédétection et SIG dans l'agriculture et Couleur de l'océan dans la zone côtière..
À la fin de cette section sur les méthodes de mesure des données d'absorption, on trouve ce graphique montrant le spectre d'absorbance d'un échantillon d'eau prélevé dans le Skagerrak, une zone de l'océan qui relie la mer du Nord et la mer Baltique. Le photomètre à double faisceau présenté deux pages plus haut avec un échantillon d'eau purifiée comme référence a été utilisé. Le spectre ne montre donc pas l'absorbance de l'ensemble de l'échantillon, mais seulement l'absorbance des substances qui s'ajoutent à l'eau.
On remarque tout d'abord l'augmentation rapide de l'absorbance au-dessous de 500 nm vers le bleu et l'ultraviolet. Cette augmentation est caractéristique des substances humiques, qui se développent à partir de plantes pourries et qui sont rejetées par les rivières dans l'océan. Les marais et les étangs contiennent ces substances en forte concentration : Un échantillon d'eau apparaît jaunâtre à la lumière parce que les parties bleues de la lumière du jour sont absorbées. La lumière restante apparaît jaune à l'œil humain. C'est pourquoi ces substances sont appelées Gelbstoffe dans la recherche marine. Pour plus d'informations, voir la section sur la couleur de l'océan dans la zone côtière.
Les valeurs d'absorbance systématiquement plus faibles pour l'échantillon filtré constituent un autre élément important. L'eau de mer contient évidemment des substances qui affaiblissent la lumière et qui peuvent être éliminées par filtration. Il s'agit de particules en suspension, en particulier de petites algues et de sédiments qui sont soulevés du fond de la mer par les vagues et les courants et qui troublent ainsi l'eau de mer.
Par conséquent, l'eau contient des molécules dissoutes qui passent le filtre et des particules en suspension qui peuvent être filtrées. Ces deux éléments contribuent à l'affaiblissement de la lumière lors de la mesure de l'absorption. Il faut en tenir compte, sinon il n'est pas possible d'interpréter correctement les spectres d'absorption.
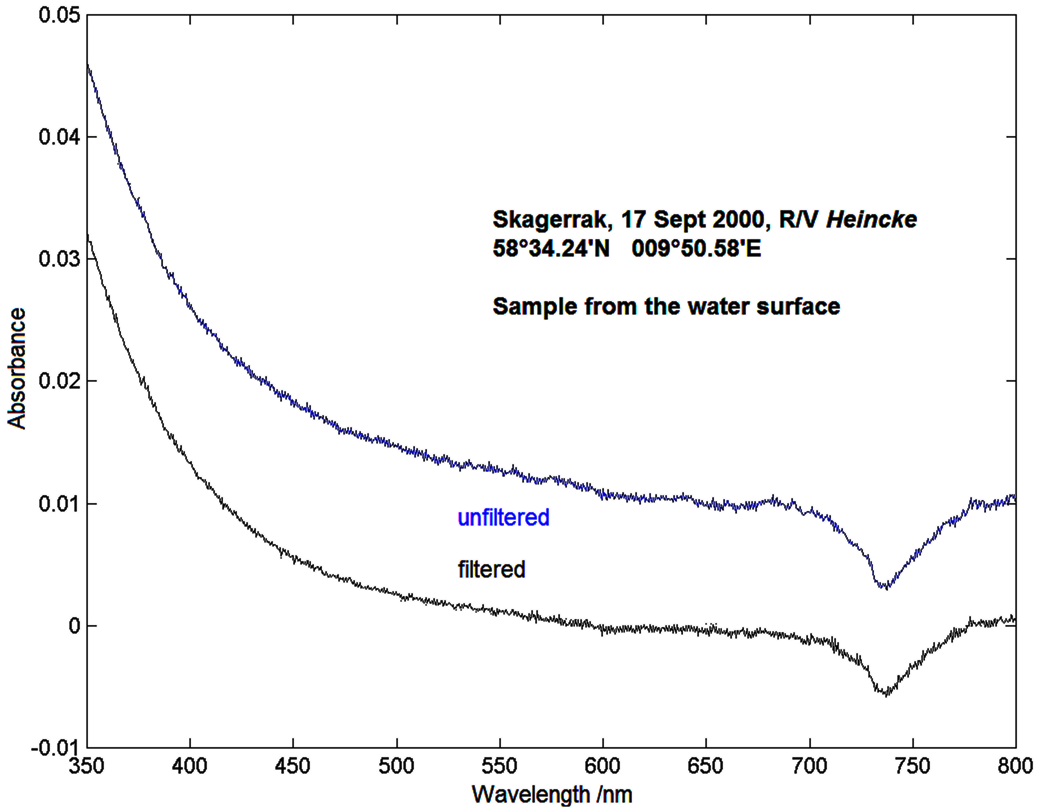
Une troisième caractéristique qui saute aux yeux est le minimum à 740 nm. Il résulte des différences de température entre l'échantillon d'eau de mer et l'échantillon de référence. Dans la section sur l'analyse des données du photomètre, nous avons découvert que les caractéristiques du solvant influencent les mesures. En effet, l'eau présente une absorbance dépendante de la température aux longueurs d'onde rouges et encore plus dans l'infrarouge. Cet effet peut également conduire à des interprétations erronées des spectres d'absorbance.
