4. Absorption and scattering
Absorption photometry (6/6)
Absorption spectra from natural environments
All absorbing matter in nature are a composites of different molecules. The former shown chlorophylls are just a small selection of plants' pigments which can be chemically isolated and identified.
In most cases, summaric information about such pigments is sufficient to define the amount and the status of vegetation such as to forecast the harvest or supervise forests and algae fields in the oceans. Obtaining this informations from satellites in space is a particular advantage when it comes to the description of vegetation in large areas on earth. This representative data could not be obtained from measurements from the ground. How satellites make this possible is explained in the sections Remote sensing and GIS in Agriculture and Ocean Colour in the Coastal Zone.
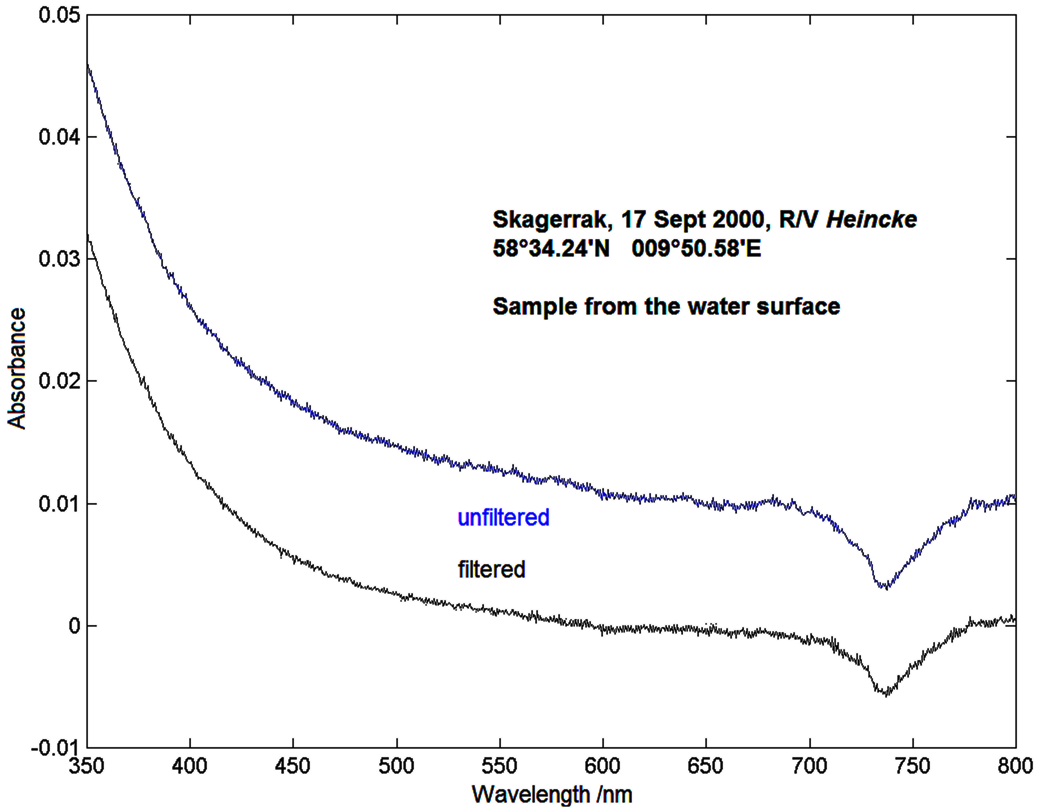
In the end of this section about methods for the measurement of absorption data there is this graphics showing the absorbance spectrum of a water sample taken from the Skagerrak, an area of the ocean which connects the North Sea and the Baltic Sea. The double beam photometer shown two pages before with a sample of purified water as a reference has been used. The spectrum hence does not show the absorbance of the whole sample but only the absorbance of substances which are supplementary to the water.
In the first place conspicuous is the fast increase in absorbance beneath 500 nm towards the blue and ultraviolet. The increase is characteristic for humic substances, which develop from rotten plants and will be flushed by rivers into the ocean. Swamps and ponds contain these substances in high concentration: A water sample appears yellowish against the light because the blue parts of the daylight are absorbed. The remaining light appears to be yellow for the human eye. That is why these substances are termed Gelbstoffe in marine research. More information can be found in the section about Ocean Colour in the Coastal Zone.
Another prominence is made up by the systematically smaller values of absorbance for the filtered sample. Seawater obviously contains substances which weaken the light and those can be removed throughout filtration. These are suspended particles, especially small algae and sediments which are raised from the seaground through waves and currents and thus blur the seawater.
As a result there are dissolved molecules in the water which pass a filter and there are suspended particles which can be filtered out. Both components contribute to the weakening of light in a measurement of the absorption. One has to keep this in mind, otherwise it is not possible to interpret absorbance spectra correctly.
A third characteristics which leaps to the eye is the minimum at 740 nm. It results from different temperatures between the seawater sample and the reference sample. In the section about Analysis of photometer data we found out that the characteristics of the solvent influence the measurements. Indeed water shows a temperature dependent absorbance at red wavelengths and even more in the infrared. This effect can lead to wrong interpretations of absorbance spectra as well.

