Worksheet 4.2: An absorption photometer for instruction in school (2/6)
Neither this, nor the following pages do replace any available instruction manual by the photometer's producer. In this worksheet, some operations will be presented which can be discussed and experimentally realised by the help of the section about absorption.
While putting up the alignment and during measurement, the light guides must not be heavily bent, otherwise the fiber glass will break. The bending radius is not to be below 15 cm.
Basic functions
After the installation of the accompanying sofware on the computer, the components have to be wired as shown in the image on the previous site. The light source, which is integrated in the cuvette holder is switched on. At first, no cuvette shall be used. When the programme is launched, the spectrometer continuously registrates spectra of the incoming light bundels which are indicated in the data window.
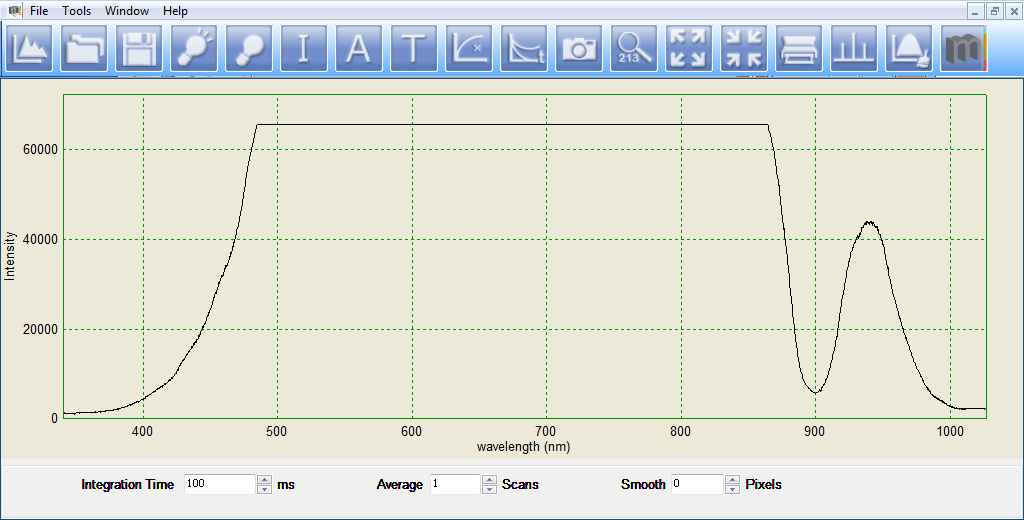
The spectrum is put up as intensity in arbitrary units over the wavelength in nanometers. The constant curve between about 480 and 860 nm does not look like a real spectrum. This is where the maximum rejection range of the detector array has been depassed, so that in consequence the spectrum is overdriven.
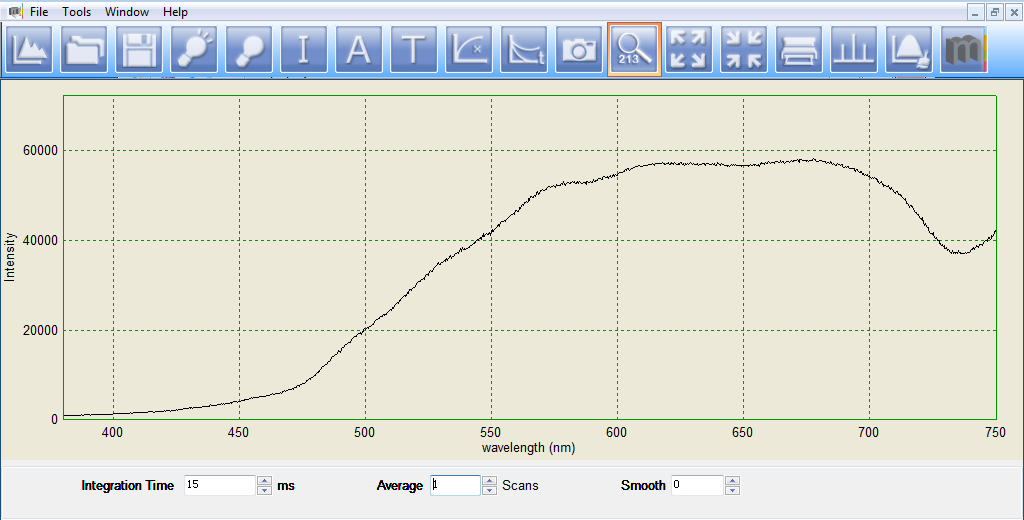
The first task is to get the detector array into a working mode of which the intensities are not too high at any point of the spectrum. The intensity values are dependent of the brightness such as the duration of which the incoming light is summed up resp. integrated. This integration time can be adjusted in the input field on the bottom of the data window. If for example reduced from 100 ms to 15 ms, the signal reaches only 15% of the original values.
![]() On top of that, the value range of the intensities and wavelengths shown in the graphics may be changed.
We assume, that we are not interested in signals superior to 750 nm, while the intensity scale shall not be changed.
This can be fulfilled in a window by clicking on the symbol shown on the right.
The result is shown in the next image.
On top of that, the value range of the intensities and wavelengths shown in the graphics may be changed.
We assume, that we are not interested in signals superior to 750 nm, while the intensity scale shall not be changed.
This can be fulfilled in a window by clicking on the symbol shown on the right.
The result is shown in the next image.