Worksheet 4.2: An absorption photometer for instruction in school (3/6)
Mesurement of the intensity of light
![]() This working mode is available, as explained on the previous pages, after starting the software.
This working mode is available, as explained on the previous pages, after starting the software.
The intensity data is not scaled in photometric units such as W/m2, but only indicated qualitatively. The spectral sensitivity of the detector elements are not corrected; an intensity in blue shown to be the double of one in red does not mean, that the light does behave alike in reality.
When removing the fibre from the cuvette holder, spectra of
- energy saving lamps and LED
- the sunlight, reflected by a white piece of paper (do not measure the sunlight directly!)
- the blue sky and of clouds
- daylight reflected on colourful clothes
![]() There is an other effect of the detectors which can be easily corrected, though. Even in darkness they produce a small signal
which is named dark current. In full darkness an intensity value of about 1000 can be observed. To see this in the data window,
the scale of the intensity axis has to be adjusted by the symbol shown on the right.
There is an other effect of the detectors which can be easily corrected, though. Even in darkness they produce a small signal
which is named dark current. In full darkness an intensity value of about 1000 can be observed. To see this in the data window,
the scale of the intensity axis has to be adjusted by the symbol shown on the right.
When reattaching the fibre to the cuvette holder, the intensity of the light transmitted through the cuvette can be measured (without spectral correction of the detectors' sensitivity).
After inserting the cuvette into the holder, it must be fixed by an angled plate; the plate has a small opening on one side to enable the passage of light and has to be aligned fitting the rest. If the plate prevents the passage of light, the dark current can be examined; otherwise the light has to pass liberately. Coloured foils can be added to the opening to disable specific spectral parts from passing.
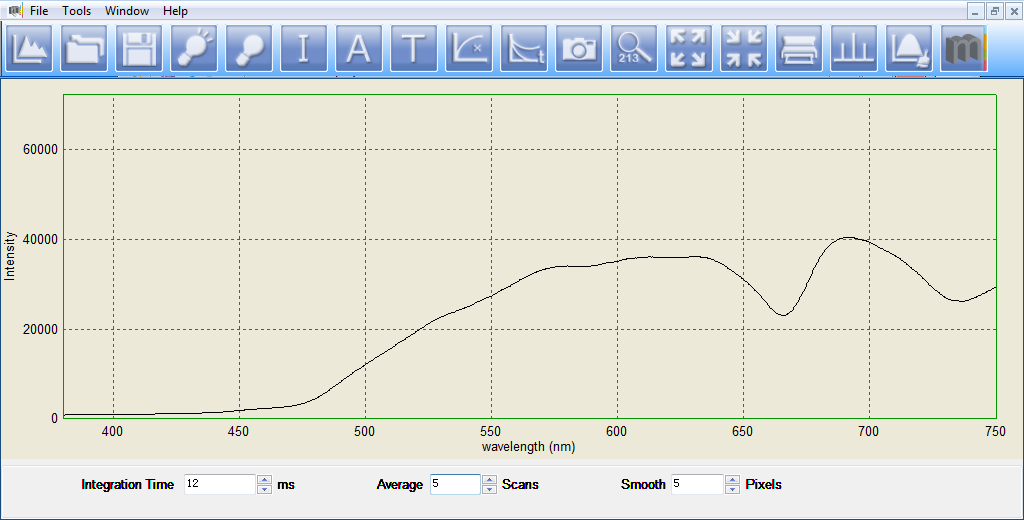
In the follwoing image it is shown as an example the spectrum of light after passing through a solution with leaf pigments, chlorophyll in particular, in alcohol. One can see that the intensities in blue and red ranges are remarkably weakened through the absorption of chlorophyll. The small signals at wavelengths below 400 nm are caused by the dark current.