Supplement 7.1: The Hydrographic Lidar Equation (3/3)
Measurements over water
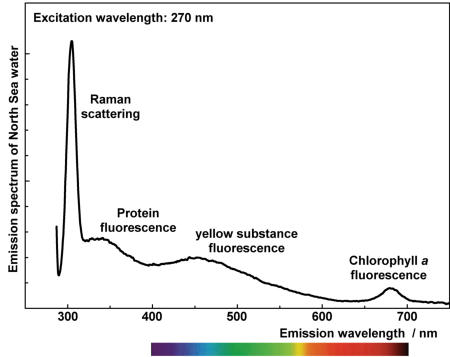
When performing measurements with a laser fluorosensor over water, one finds spectra which include water Raman scattering and fluorescence from substances in the water.

In this section a water column having a homogeneous vertical distribution of fluorescent substances within the depth of signal reception is assumed.
The concentration of water molecules is virtually constant. The molecular water Raman scattering efficiency depends on the chosen laser wavelength but is only weakly varying with temperature and salinity. Hence, when measuring water Raman scattering the signal efficiency ηL,R can be considered to be a constant in a first approximation (subscripts L and R denote the laser and the Raman scattering wavelengths). Following a subtraction of fluorescence background from fluorescent substances in the spectral region of water Raman scattering, the detected signal becomes:
This relation includes one variable only, i.e., the sum of attenuation coefficients at the laser and the water Raman wavelengths cL,R=cL+cR. It can be therefore used to measure the vertically averaged attenuation coefficient of water.
A similar relation holds with the signal detected at wavelength where substances in the water exhibit fluorescence:
Here, the fluorescence signal efficiency is not a constant but depends on the type and concentration of fluorescent matter in the water. The relation cannot be used to derive data of the distribution of fluorescent matter since cL,F=cL+cF is also variable.
However, normalising the fluorescence signal to the water Raman scattering signal,
considering ηL,R=const., and assuming cR ≈ cF, i.e., the attenuation coefficients at the water Raman scattering and the fluorescence wavelength are approximately the same, it follows:
This relation includes the fluorescence signal efficiency only, which is given by the fluorescent matter concentration and the molecular fluorescence efficiency. Assuming the latter to be a constant, these data make it possible to measure the distribution of fluorescent matter concentration with a laser fluorosensor. This is denoted as water Raman normalisation, and fluorescence values normalised in this way are given in Raman Units.
Measurements over oil spills
Laser fluorosensor measurements performed at a number of representative fluorescence wavelengths over an optically thick portion of an oil spill yield a direct determination of the spectral oil fluorescence efficiency ηo normalised to the oil absorption coefficient ao (oil is an absorbing substance, scattering is negligible, and therefore the absorption coefficient a is identical with the attenuation coefficient c):

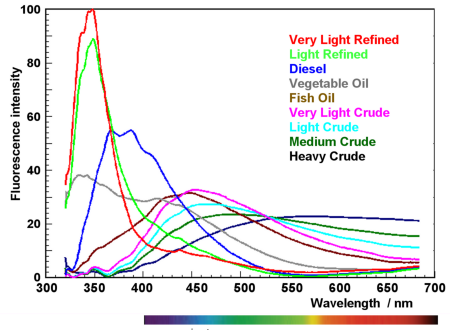
From the spectral data obtained over thick oil one estimates
- the oil type, as shown in the graph above,
- and the absorption coefficient of the oil.
With this information the oil film thickness d can be determined at locations of the oil spill where the film is not optically thick and partly transparent, and hence signal contributions from the underlying water are obtained as well. According to the two-layer solution of the hydrographic lidar equation the following signal is measured:
In addition, one measures signals from oil-free water:
We assume that the optical properties of the water surounding and underlying the oil spill are invariant. Combining all these signals, one obtains:
This equation can be inverted to calculate the oil film thickness d.
If, for a determination of , optically thick parts of an oil spill cannot be identified, a film thickness determination can still be achieved at wavelengths where the oil fluorescence intensity is small with respect to the signal of the water, in other words, the oil being a stong absorber. This holds particularly for medium and heavy crude oils and heavy fuel analysed with near UV laser and detection wavelengths. In particular, water Raman scattering represents a strong signal when compared to oil fluorescence at UV wavelengths. With » ≈ 0 one has:
The floating depth z2 of submerged oil, with a water surface free of oil, can be estimated at the same wavelengths, again assuming negligible oil fluorescence. Normalising the signal to the signal outside the spill gives:
The presence of an additional oil film on the water surface is then characterised by 3 layers with 7 independent parameters, see the relations on the previous page, of which only ηWater/cWater can be specifically determined from measurements over surrounding oil-free water. A determination of the oil film thickness d could be established if d were constant, above and near the submerged oil. A combination of these signals yields:
