4. The Quality of the Regression Equation (2/3)
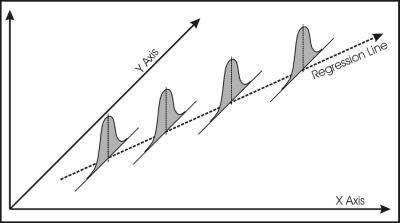
One can think of SST as a measure of the capacity of the mean value to estimate y from x; the more of this variation that is explained by the regression equation, the better is that equation at estimating y from the x values. Thus the closer SSR gets to SST, the better is the regression equation at explaining the variations in y as a function of x. The Coefficient of Determination shows the proportion of the residuals that are explained by the regression equation.
In our example, 85.95% of the variation in GLAI is explained for Winter Wheat and 79.42% is explained for Spring Barley using simple linear regression. Better results may be achieved using a higher order polynomial function.
One of the problems with the Coefficient of Determination is that it does not take the size of the sample into account. Thus, with just two observations, one could find a linear model, it would fit perfectly through the two points and have an R2 value of 1.0. However, you would not normally have very high confidence in just two observations being representative of the population.
To deal with this situation, the F statistic is used as a more robust test of the quality of the regression in explaining the variation in the y values relative to the x values. The F statistic is actually used to test the hypothesis that the regression gain value (b1) is zero, called the NUL Hypothesis. If b1 = 0, then there is no relationship between the independent and dependent variables.

The logic for using the F statistic is based on our ability to derive two estimates for the variance associated with the residuals from the regression. The SSE provides one estimate of this variance. If the gain value is zero, which means that the regression is not significant, then the SSR forms the basis of a second estimate of the variance of the residuals. The F statistic is the ratio of these two estimates of the variance. If the F statistic is close to one, then the NUL hypothesis would be accepted, which means that the regression is not significant; whereas if the NUL hypothesis is rejected, then we can accept that the regression is significant.
