Subjects:
Biology, primary production, nutrients, eutrophicationObjectives:
Observe the seasonal cycle of phytoplankton and discuss the basic reasonsMaterials:
- Two images to show
Time needed:
- One school lesson
Procedure:
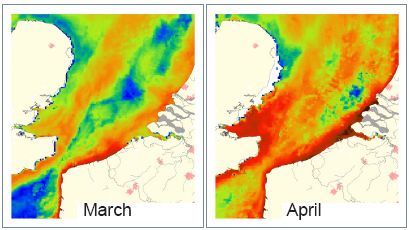
The student will first observe two maps of the amount of Chlorophyll-a in the coastal waters of Belgium. Both images are produced in the European project REVAMP. The maps are based on observations with the ESA MERIS instrument that can detect ocean colour from the coastal waters. The observations have a spatial grid of 3 by 3 km, but the original observation has a spatial resolution of 1 by 1 km-squared. After discussing the colours and legend that are explained in Chapter 2, the students will observe the strong increase in phytoplankton near the coasts. Then a coupling will be made to the observations at one point for over 10 years. In this way we hope that the student can link a spatial image of one month to a time series at one point. Subsequently, because a seasonal curve at one point is easier to understand than variable patterns, some questions are asked about the growth cycle of phytoplankton.Content:Phytoplankton bloom in Belgian coastal waters
Source: REVAMP Atlas

Source: REVAMP Atlas
1) Spring phytoplankton bloom from Space The April image shows a widespread phytoplankton bloom in the southern North Sea for both coastal and offshore waters. Long term monitoring data in Belgian coastal waters reveals a Chlorophyll-a peak this April month with strong seasonal variability.
2) Spring phytoplankton bloom measured from a ship. The Figure below shows an example for a station located at 25km off Oostende (indicated by a red square in the Figure). In situ Chlorophyll-a measurements range from approximately 5 to 30 mg m-3 in April and decrease to an annual minimum level ~1 mg m-3 in December or January. REVAMP Chlorophyll-a varies from 8 to 24 mg m-3 for this station in April 2003, which is consistent with in situ data. Seasonal variability of in situ Chlorophyll-a at 25km off Oostende. (Data obtained from Belgian Marine Data Center originating from MUMM and the Universite Libre de Bruxelles).
Q 1. Why is the concentration of algae so low in the winter months?
A 1. The sun is too low and provides not enough energy to sustain photosynthesis.
Q 2. Why is the concentration of algae so low in the summer months?
A 2. Because most nutrients are consumed and are locked in animals or dead material.
Q 3. Generally we observe a small bloom at the end of the summer, can you explain why?
A 3. Bacteria have degraded dead biomass and have released the nutrients again.
Q 4. Can you describe the differences that you observe in these images?
A 4. Clearly there are large difference close to the coast of Belgium and The netherlands and the UK. In these coastal zones plenty of nutrients have accumulated that are available once the Spring bloom starts. Also in the middle of the Southern North Sea algae start to grow, but reach less higher concentration levels. The overall flow of water is fom South to North. Notice that the plume of algae that are coupled to the Theems estuary seem to indicate that nutrientes are transported to the North-East and causing algal blooms futher away from the Theems river Mouth.
Implications for eutrophication assessment: For Belgium, the Netherlands and Germany, one of the criteria used to determine whether an area has a eutrophication problem (in the sense of the 1992 OSPAR convention) is whether the annual Chlorophyll-a maximum exceeds a threshold of 15 mg m-3. This image shows that this threshold is indeed exceeded for the entire Belgian-Dutch-German North Sea coastline.
