5. Educational Game (2/2)
Ecosystems and health
With the previous softwares you performed most of the actual work on an external server. BEAM requires software installation, putting data on your PC and quite a lot of subsequent interaction. We suggest that you either look at a demonstration from your teacher or work with the screenshots below. Discuss how satellite data gives information about:
- Ecosystems: Eutrophication indicator threshold
- Health: Extraction of CHL values at certain locations
Ecosystems: Eutrophication indicator threshold
You can use image-processing software to extract information about eutrophication (Peters et al., 2005).
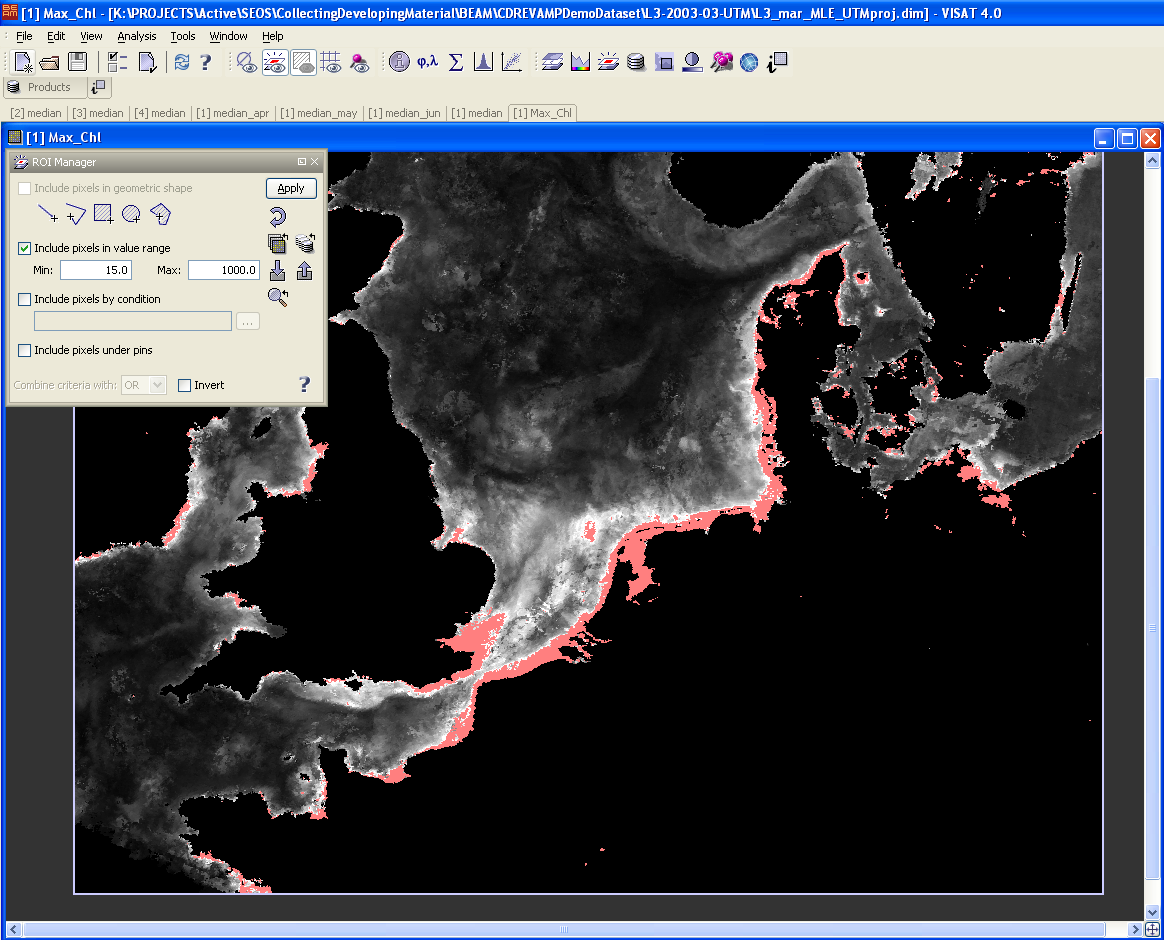
Chlorophyll concentrations over 15 micrograms per litre are shaded pink.
Source: The REVAMP project
Source: The REVAMP project
Health: Extraction of CHL values at certain locations

Extraction of values at a certain location near Spiekeroog: median in March, April, May and June.
Source: The REVAMP project
Source: The REVAMP project

Extraction of values at a certain location near Spiekeroog: median in March, April, May and June.
Source: The REVAMP project
Source: The REVAMP project
