6. Stromen vanuit de ruimte (in het Engels)
Measuring ocean currents
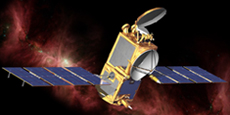
The Envisat and Jason satellites both carry radar altimeters, RA-2 and CNES Poseidon-3 Altimeter respectively.
These sensors work by transmitting a pulse of microwaves towards the Earth’s surface and then measuring the time
taken for the pulse to return. This data allows Oceanographers to calculate the height of the ocean and subsequently
speed and direction. This allows us to build up invaluable knowledge about surface, and surface affecting, ocean
currents on a global scale over a long time period.
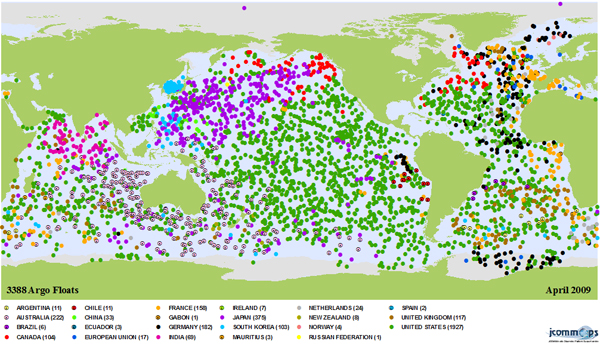
An Argo float is about 1.1 m tall, weighs about 25 kg and can operate at up to 2000 m depth, they last about 4-5 years.
The float is capable of adjusting it's buoyancy to float with the current and measures temperature, salinity and depth.
The floats surfaces every 7-10 days to transmit data to satellites, when they do we can record where they have been and
look at the properties of the water that they have travelled in. This allows us to derive a great deal of information
about ocean currents. (The program is called Argo to complement the Jason satellites as argo was the boat the Jason
sailed in with his argonauts.)
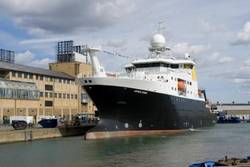
The RV James Cook, docked at the National Oceanographic Centre, Southampton.
Bron: Mike Conquer, NOCs
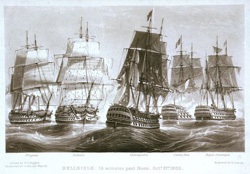
Tall ships of the kind that recorded drift data.
Bron:
Wikimedia
Although satellite data can tell us a lot about how the oceans change with time, even the very best cannot tell us what
is happening deeper in the ocean. To look at this oceanographers use floats, ships and moorings. Scientists go to sea
aboard ships for long periods of time to look at surface and deep currents (among other things).
In the old days oceanographers used to rely on data recorded by ships as they drifted while sailing to calculate
currents. This data was recorded by Navy vessels all over the world and is still used in some oceanography research
today. Ship drift data is our longest time series for ocean current data, Satellites and floats have not been around
that long!
Today research vessels are used to measure currents from hull fitted Acoustic Doppler current profilers and frequently
deploy other methods of measuring ocean currents making them a core part of Oceanographic research.
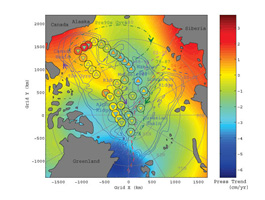
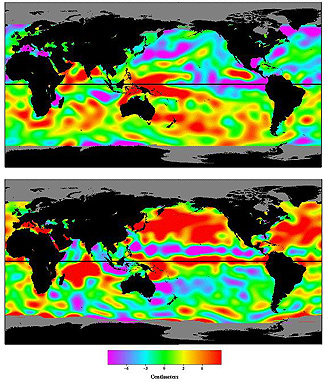
Ocean bottom pressure data from the GRACE
Bron:
NASA/JPL
Pressure sensors can be used to study large-scale ocean currents indirectly. The pressure at the bottom of the
ocean is determined by the mass above it. Where ocean currents and surface winds move water above the pressure sensor
the pressures change. This allows use to determine sea level and hence where water will flow from and too.
It is also interesting to note that as of 2009 the GRACE satellite mission is starting to generate good views of
ocean bottom pressure.
We can moor current meters to buoys to measure the flow and direction of water past the sensor. This can give use
surface information and we can also attach further instruments down the cable to measure at various depths. In addition
there is a piece of equipment called a moored profiler that can climb up and down the mooring cables measuring the whole
range of salinity, temperature and current.
Moored floats can also be used that listen for fixed sonar pulse and record local conditions, these moored floats can
provide high quality long term data about currents. They are especially good for studying boundary currents and eddy
systems.
Surface buoys have the disadvantage that they are very vulnerable to ships, and surface weather that may damage or
disrupt the buoy. Whereas shallow subsurface moorings may fall victim to fishing vessels. For deep areas or places
where we require high detail long-term data sets these technologies are invaluable.
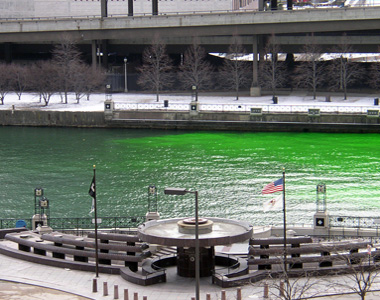
Dye released in the Chicago river, as the dye spreads you can track outflow. (In this case the dye was released
for a festival, but the principle is the same!)
Bron:
Wikimedia Commons
From an oceanographic perspective a dye is a kind of tracer. We regard anything that allows us to monitor an ocean
process that would otherwise be invisible to be a tracer. It is possible to uses dyes to measure local surface currents.
The dye is released into the water and it's spread can be watched, in person, by plane, water sample or sometimes even
by satellite.
However, there are many other less visible ways in which we can use tracers to monitor the ocean. Oceanographers can
track bodies of water by their salinity, potential temperature, oxygen, carbon dioxide and nutrient loads. We can also
look at the spread of phytoplankton blooms and river discharge. It is even possible to use radioactive isotopes to track
a body of water by taking samples and looking at the water chemical composition. Even an oil spill can serve as a tracer.
It is worth noting that tracking water with tracers is not necessarily simple. Bodies of water interact and mix and
biological organisms may use or release components from or to the water. However, these parameters are still a very
good tool for studying currents in the ocean.
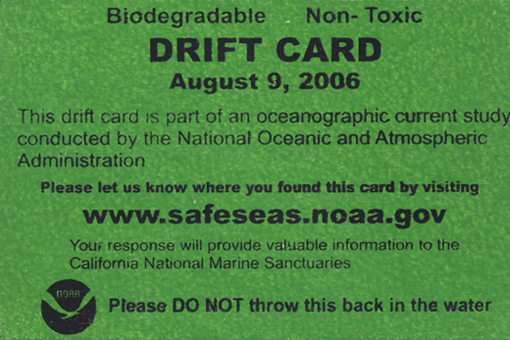
Drift cards are usually used to track relatively local currents. An organisation has biodegradable cards printed
that are thrown into the ocean at a set point. When these wash up and people find them they can be put in the post or
their location logged online so researchers know where they were found.
Oceanographers then know how long the card took to arrive and can use this to, for example, model how pollution
(e.g. oil) or non-native plant species would spread with the current.
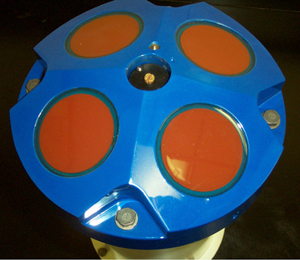
An acoustic Doppler current profiler or ADCP is used to measure how fast water is moving through the whole
water column. They can be used in several ways. An ADCP may be towed behind a ship, moored or anchored to the
seabed ('looking' up to the sea surface). They can also be fixed horizontally to measure the current across
a (relatively) small body of water.
ADCP works by sending out a pulse of sonar and 'listening' for a return. This return comes from particles in the
water, if the particles are moving it is subject to Doppler shift. The amount of shift can be used to calculate the
speed and direction that the water is travelling, giving us detailed localised current information.
Telephone, power and internet cables are all laid across the sea floor. These cable are pulled around
by ocean currents and drift with flows. The drift of these cables can be used to supplement other data or to
help predict were best to lay a new cable to avoid it snapping.
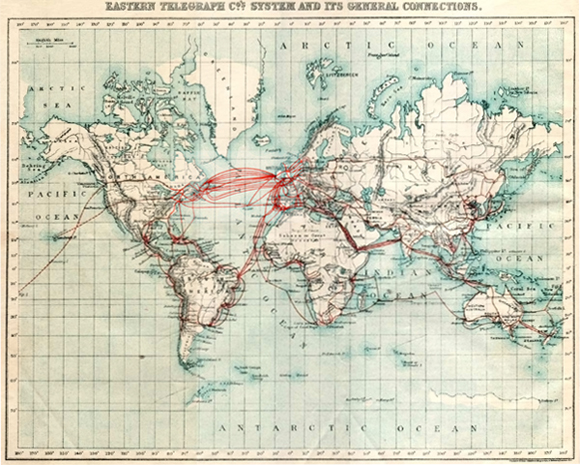
A 1901 map of submarine cables, as you can imagine there are a lot more now!
Bron:
Wikimedia Commons.
In May 1990 a storm south of Alaska knocked 21 containers off the Hansa Carrier, a container ship on its way
from Korea to the USA. Five containers broke open, releasing some 61,000 trainers and boots into the north Pacific.
These shoes all had an individual serial number, listed in the ships logs. As such this was the largest known
release of numbered drifters into the ocean, 2.6% of the shoes were recovered and used to help improve oceanographic
models!
The rubber ducks were another story again, though in a similar vein.
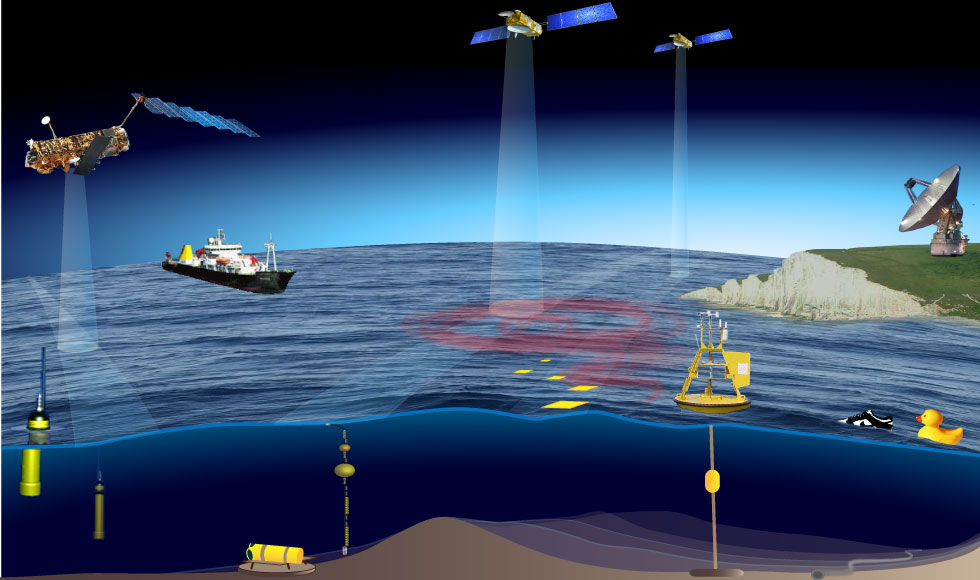
Click on the image to learn more about the different methods used to measure ocean currents
Satellite and in situ measurements
Satellite measurements give us a broad overview, and tell us how currents vary in time and space. However, we also need
data from other Brons: instruments anchored to the sea floor (moorings), drifting with the currents (floats), or mounted
on buoys, platforms and ships.
Together these different measurements can help us understand what controls the flow of water in the ocean and along our
coasts.
The measurements may be combined with numerical models used to forecast the transport of sediment or pollutants or to
investigate how the ocean system might react to external changes such as global climate change.
Staying put or going with the flow?
Traditionally there are two direct ways to measure currents: you can add something to the water and follow it as it
moves (Lagrangian measurements), or you can place an instrument in a fixed position and measure how fast the current
flows past it (Eulerian measurements).
Currents may also be measured indirectly: by measuring other parameters and using these to calculate the current speed
and direction. Oceanographers use all these methods to learn about flow in the ocean.
The illustration above shows different ways to obtain data on current speed and direction. Follow the links in the
image to find out more about each method, and decide if it is Lagrangian, Eulerian, indirect
(derived from other parameters), or perhaps a mixture of these.

