5. Urban Planning
Remote sensing and distribution of population
Remotely sensed data have been used in attempts to:
- estimate population
- quantify urban growth
- monitor the density of urban areas or in other words the "land consumption" that is used to refer to the amount of urban/built-up lands that people use
- determine which areas are more popular for each land use
- identify territorial differences between population groups in respect of needs and satisfactions
- identify problems that are caused in some areas by urban growth(such as problems of water supply and contamination, sanitation and waste disposal, air pollution, and industrial pollution)
- determine areas that have a possibility of danger (such as physical disasters) and population have to avoid them
Factors that can be determined by remote sensing and influence the distribution of population
The spatial relationship between population and the physical environment can be quantified by calculating the distribution of people with respect to a particular parameter that characterizes the environment. Environments are often described in terms of climatic parameters related to temperature and precipitation. Both of these parameters vary appreciably at different temporal and spatial scales so averages are often used to summarize the climate of specific locations. Environments are also characterized by landscape or continental physiography. Physiographic parameters that might be expected to influence human habitation include elevation and proximity to coastlines and rivers. All of these quantities can be measured or estimated to different degrees of accuracy and resolution and used as a basis on which to calculate global distributions of land area and population.
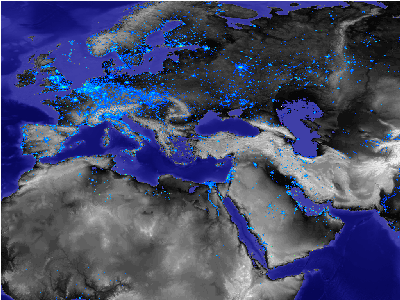
Combining the use of nightlights and population to show the spatial extend of urban land uses
The current demographic shift from sparsely populated rural to densely populated urban environments is a distinct form of global change. It is distinct from other types of global change in the sense that a rapidly increasing number of people are experiencing environmental change, not only as result of the environment of a particular location changing, but also as a result of growth centers shifting to different physical environments.
The delivery of urban social services and the supply of basic utilities infrastructure present a wide range of management problems in rapidly growing urban areas with limited resources. In addition there are marked differences in levels of access to basic social services such as education and health care between different groups among the population and between different localities within urban regions. Similarly, there are considerable discrepancies in the supply of urban water and electricity to different parts of the city and this often fluctuates during the day.
Key research topics within this theme focus on the development of management and decision support tools to make the best use of the limited resources that are available. A project carried out to identify priority areas for the construction of health clinics in Dar es Salaam in Tanzania illustrates the practical need for planning urban service provision in many of the urban centres in the developing world. Over the past decades, the city has experienced high rates of population growth. With a population of around 2.5 million it is by far the largest urban centre of the country. Estimates indicate that over 70% of the city's inhabitants live in unplanned settlements. In most cases, these settlements are characterised by high rates of unemployment, substandard housing, and limited access to safe drinking water, sanitation, electricity and basic social services. As a result, the expanding population of Dar es Salaam is confronted with serious problems of urban poverty and unhealthy living conditions.
To fulfill its mandate to combat poverty in hardship regions, the UN Development Programme (UNDP) has a wide range of geographic information needs. It uses satellite imagery in a variety of ways to meet those needs. Using commercially available EO data, as shown here from the UNDP Somalia GIS lab, UNDP can assess "informal settlements" around Nairobi, Kenya. According to satellite image spectral analysis, what is here seen in white represents informal settlements; black represents urban areas; and the two shades of gray represent vegetation (darker gray for dense vegetation, lighter gray for less dense vegetation). Other UNDP uses of satellite imagery include radar imagery for flood assessments and optical sensors for land-use analyses and population estimates of major towns.
Growth in "mega-cities" is altering the landscape and the atmosphere in such a way as to curtail normal photosynthesis. By using data from The Defense Meteorological Satellite Program's (DMSP) Operational Linescan System, researchers have been able to look at urban sprawl by monitoring the emission of light from cities at night. By overlaying these "light maps" onto other data such as soil and vegetation maps, the research shows that urbanization can have a variable but measurable impact on photosynthetic productivity.

