1. What is a Time Series and why are they Important?
The concept of time series
A time series is an ordered sequence of values of one or several variables at (generally) equally spaced time intervals.
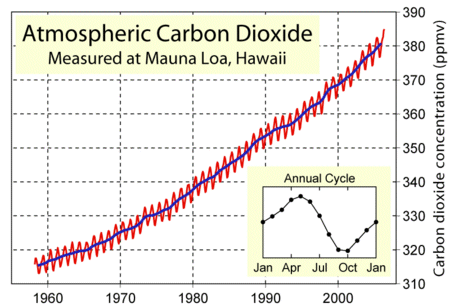
An example of a time series is the atmospheric carbon dioxide (CO2) record from Mauna Loa in Hawaii. We are going to look at this time series in more detail in a Case Study later in this tutorial. The plot in the right column shows monthly values of carbon dioxide concentration plotted in red. You can see that there is a regular variation within each year - the annual cycle - and an overall increase over many years - a trend (shown in blue).
Does the shape of the graph give you any clues about the processes that affect how much carbon dioxide is present in the atmosphere?
What differences would you expect if these measurements were made in the southern hemisphere?
The annual cycle is a real part of the data - the carbon dioxide concentration changes through the year - but we might only be interested in the overall trend. We will see in the Case Study how we can separate out the different parts of the signal.
A time series of data can tell us about how a system or variable has behaved (the past). This information may help us to understand why the system behaves in this way but it also entices us with the thought that we can perhaps predict what will happen next (the future).
This is the big attraction of time series and one of the reasons that so much effort is put into their analysis. If the price of shares or houses or oil has always gone up in the past, it must continue to do so...
Do we need to understand the processes that give rise to a time series before we use the time series to make a prediction?

Source: NOAA Mauna Loa Observatory
The Mauna Loa measurements represent a simple time series - all the measurements are taken at the same place and at regular intervals. Not all time series are like that. We may have measurements made in different places, at different intervals, perhaps using different methods.
