1. What is a Time Series and why are they Important?
Time series analysis
We are interested in time series because we want to be able to
- understand (or improve our understanding of) the data generating mechanism,
- fit a model to the time series
- forecast or monitor the time series
- possibly to control (or influence) the time series
In time series the value at a given time often depends on the previous values. Some of the standard ways of analysing large amounts of data should not be used when there is this sort of dependence on previous values. Examples: The weather today depends more or less on the weather yesterday. But when you throw a dice then the numbers are not dependend on the previous result.
Time series analysis provides tools to help identify and interpret the structure of a time series - for example the seasonal changes, a trend.
In time series analysis we aim to:
- identify the nature of the phenomenon represented by the sequence of observations,
- forecast (predicting future values of the time series variable).
In order to do this we need to
- identify the pattern of observed time series data
- express this pattern in mathematical terms
- interpret the pattern in the light of other data/theories
- integrate it with other data to refine/develop theories
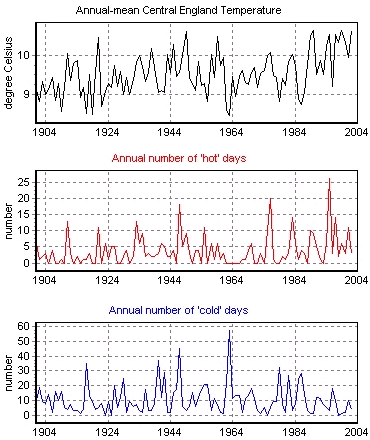
The longest continuous record of measured surface air temperatures in the world exists for a region representative of the English Midlands. Daily records extend back to 1772 and monthly records to 1659. Annual temperature fluctuations in this region are representative of those in most of the UK. The data are quality controlled and updated monthly. The specific indicators chosen are the annual-mean temperature and the number of hot and cold days each year. A hot day is defined as when the daily mean temperature (i.e., the average of minimum and maximum) is above 20°C; a cold day is when the daily mean temperature is below 0°C. [Source: The Climatic Research Unit, University of East Anglia, Norwich NR4 7TJ]
How does this series differ from the ones we have seen already? What sort of questions do you think a dataset like this can help answer?

Source: Department for Environment, Food and Rural Affairs, UK
Are there more hot days now than there used to be? Are there more cold days in years without a lot of hot days? Note that the definitions of hot and cold are quite strict.
Is this time series long enough to give us a sensible answer to these questions?
Time series analysis can provide the tools for working with such datasets.
