2. Working with Time Series
Measurements in the Wadden Sea (3/3)
You might have realised that it is not easy to identify a temperature trend, mostly because of the seasonal fluctuations in the signal. To avoid this problem, one could select a specific month of the year. This was done by the Federal Maritime and Hydrographic Agency, Hamburg, for the temperature data of the entire North Sea in October, as shown in the following graph.
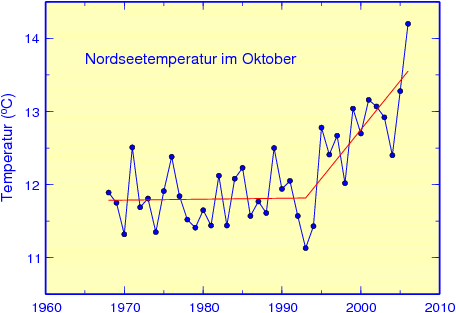
Source: Bundesamt für Seeschifffahrt und Hydrographie, Hamburg
This time series indicates a rather dramatic temperature rise of about 0.13°C per year between 1993 and 2006! Can a similar trend be found in the data set measured in the Wadden Sea?

Indeed, the Wadden Sea temperature data indicate rising temperatures until 2006 as well. But temperatures were decreasing in 2007 and 2008. Therefore, the regression line for all data points shown in the graph has a much weaker slope than a line would have when calculated for the years 2002 to 2006 only.
The equation of the best-fit line for the years 2002 to 2008 is:
where T is the seawater temperature in °C and t is the year.
It would be useful to extrapolate this equation rightwards, to predict future seawater temperatures. This however is incorrect! The equation represents a regression line for the measured data only, and cannot be used to calculate previous or future temperatures! In terms of mathematics, it is not a line that extends forever in both directions; instead, it is a line segment that extends between the first and the last data point in the diagram.
Let‘s have a look at the methods to calculate such best-fit staight lines!
