Supplement 5.3: Satellite Measurements of Sea Ice (4/4)
Ice thickness
The thickness of sea ice can be calculated from measurements made from satellites. Satellite altimeters can measure the height of sea ice above the water surface. These can be radar altimeters like the one on ENVISAT or ERS, or the one to be launched on Cryosat. Lidars can also measure the surface height and on this page we will be looking at how ICESat has been used to monitor ice thickness in the Arctic.

NASA
What is actually measured?
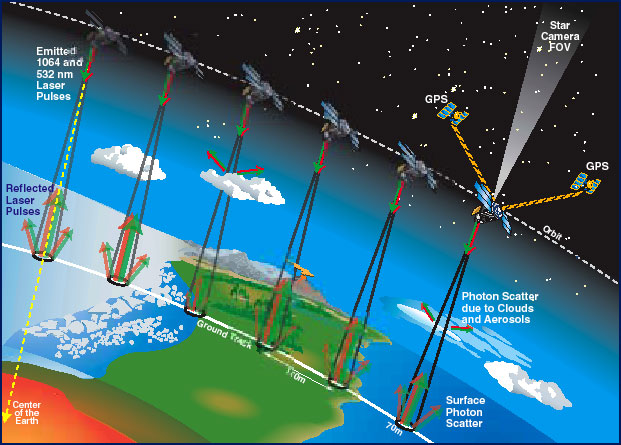
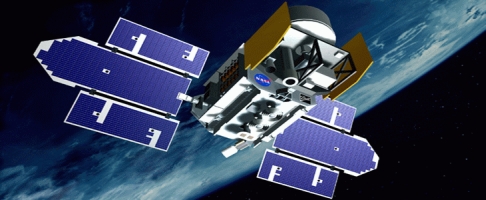
The Geoscience Laser Altimeter System (GLAS) on ICESat includes a laser system to measure distance, a Global Positioning System (GPS) receiver, and a star-tracker attitude determination system. The laser operates at two wavelengths, and transmits short pulses (4 nano seconds) of infrared light (1064 nanometers wavelength) and visible green light (532 nanometers). The infrared pulses are used to measure the distance from the laser to the surface. The time taken for the return journey laser - surface - laser is measured, and this is converted to distance. So the GLAS can measure the height of the ice above the water surface - a quantity known as 'freeboard'.

From freeboard to thickness
Buoyancy causes a fraction (about 10 percent) of sea ice to stick out above the sea surface. By knowing the density of the ice and applying “Archimedes’ Principle” -- an object immersed in a fluid is buoyed up by a force equal to the weight of the fluid displaced by the object -- the total thickness of the ice can be calculated.
ICESat data show Arctic Ice thinning
Scientists from NASA and the University of Washington in Seattle have used ICESat data to make the first basin-wide estimate of the thickness and volume of the Arctic Ocean's ice cover. Their results show that Arctic sea ice thinned dramatically between the winters of 2004 and 2008, with thin seasonal ice replacing thick older ice as the dominant type for the first time on record.
The overall Arctic sea ice thinned about 0.17 metres a year, for a total of 0.68 metres over four winters. The total area covered by the thicker, older "multi-year" ice that has survived one or more summers shrank by 42 percent.
The results are summarised in the Figure below. More information about this study can be found on this NASA website
There are only 5 points in each plot. ICESat was only launched in 2003, and the first full set of Arctic sea ice measurements was made in 2004.
Do you think that this time series is long enough for trends to be established?

Source: NASA/JPL
Before 2004, scientists had satellite measurements of area to determine how much of the Arctic Ocean is covered in ice, but there were only local measurements of ice thickness. ICESat makes it possible to monitor ice thickness and volume changes over the entire Arctic Ocean. This gives scientists a better understanding of the regional distribution of ice and provides better insight into what is happening in the Arctic.
Cryosat (see previous page) will also provide measurements of ice thickness. Whilst the spatial resolution of Cryosat is not as good as ICESat, Cryosat can see through cloud.
Combining data from different sensors can also tell us more about ice in the Arctic. For an example take a look at the information on this NASA website.

