7. Water Analysis Using Lidar
Measurement of natural properties of water (2/3)
The diagrams on the next page show results of measurements taken at the German Bight with a laser fluorosensor on an aircraft. Two laser wavelengths were used to specifically stimulate water Raman scattering as well as the fluorescence of different substances.
With excitation at 308 nm (ultraviolet),
- water Raman scattering was determined at 344 nm, which was used to compute the UV attenuation coefficient (mean value at 308 and 344 nm);
- the fluorescence of yellow substances was measured at 450 nm; normalised to water Raman scattering at 344 nm it corresponds to the concentration of yellow substances.
With excitation at 450 nm (blue),
- water Raman scattering was determined at 533 nm (green), which was used to compute the attenuation coefficient in the blue-green spectral region (mean value at 450 and 533 nm);
- chlorophyll fluorescence was measured at 685 nm; normalised to water Raman scattering at 533 nm it corresponds to the relative Chlorophyll concentration.
The Raman effect of water is explained more thoroughly in Supplement 7.3, and the methods of Raman normalisation of fluoroscence signals on page 3 of Supplement 7.1.
The southeastern part of the German Bight is influenced greatly by the outflow of the Elbe River flowing northwards along the coast of Schleswig-Holstein, as evidenced by the high attenuation coefficient values and the high fluorescence emissions of the yellow substances contained in the river water.
The area around Helgoland exhibits much lower values. Different water types are identifiable, particularly because the fluorescent emissions of yellow substances distinctly separate them from one another, showing sharp borderlines. Algae in sea water, identifiable through their chlorophyll fluorescence, are apparently not directly related with other parameters and are rather randomly distributed.
The borderlines which make the distribution of yellow substances in the water visible are called hydrographic fronts. In the eastern part of the bight, sea water is diluted with river water and is therefore less salty and less dense so that it overlays the much saltier and much denser water of the North Sea. Where two such waters converge, the density and salinity isolines are inclined. If they intersect the sea surface, they form what is called a front in the ocean.
The picture on the left shows a river discharge front visible by a foam line and a bright surface film. The drawing on the right illustrates the isolines of constant density - the isopycnals.
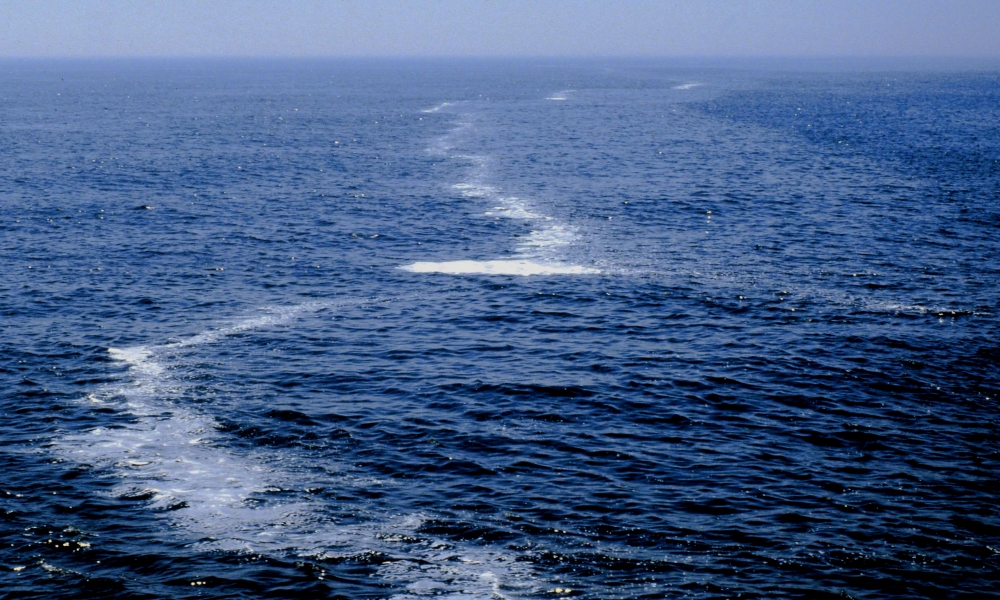
Right: Schematic presentation of the vertical structure of a river discharge front. The less dense river water overlays the seawater. The front is where the lines of constant density (isopycnals) intersect the sea surface. Due to a transverse flow, converging to depth at the front, foam and a surface film is formed from hydrophobic organic molecules. Fronts can also be recognised by a sudden change of the ocean colour since river water carries many suspended particles (silt, algae, bacteria).
With laser spectroscopy and by measuring water Raman scattering and fluorescence emission, specific data about the clarity of seawater and about organic substances in the water, particularly humic substances (yellow substances) and algae (phytoplankton) can be obtained. These properties are present as individual structures in the spectrum so they can be easily extracted out of the spectrum without having to use complicated conversion methods such as the case with using ocean colour, for instance. Very high detection sensitivity for very small quantities is also possible.
