Supplement 5.3: Satellite Measurements of Sea Ice (3/4)
Radar
Radars are active microwave sensors. They send a beam or pulse of radio energy down to the surface and detect the reflected or scattered energy. The physical properties of objects at the earths surface determine the amount and characteristics of microwave radiation returned to the sensor.
In particular, the surface roughness has a major influence on the way radiation is reflected and scattered. Smooth ice or ice covered with a thin layer of melt water will behave like a mirror, whilst rough ice or ice covered with snow will scatter radiation in many directions. See Supplement 5.2 for more about reflection and scattering.
One type of radar, the altimeter, looks straight down at the surface (zero incidence angle) and measures the signal reflected at the same angle back to the radar. This is the mirror model of reflection. Other radars, the scatterometer and imaging radars look at an incidence angle of between 20 and 50 degrees and measure the signal scattered back by any surface roughness.
The spatial resolution you can get with radar sensors ranges from tens of metres to tens of kilometres.
Altimetry
The radar altimeter sends a pulse of radar energy toward the earth and measures the time it takes to return to the sensor. The round-trip time gives the height of the satellite from the reflecting surface. If the position of the satellite is known accurately relative to a reference level, the height of surface features can be determined.
An altimeter on a satellite 1000 km above the surface can measure differences in surface height of the order of a few centimetres. The altimeters in use on satellites are usually Ku band or C band.
See tutorial Ocean Currents for more about altimetry.
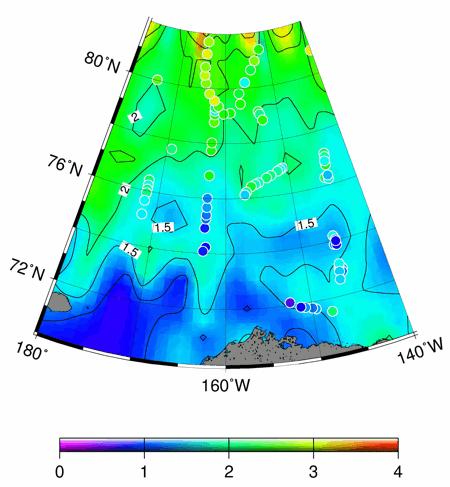
Altimeters can determine the thickness of floating sea ice by measuring the freeboard of ice floes; that is the height by which the ice extends above the water surface. This is the same quantity measured by the infra red laser on ICESat, but radar instruments can see through cloud cover. See the ICESat page. Radar altimeters such as the ones on ERS-1 and ERS-2 and ENVISAT have demonstrated that this technique works, although these altimeters have a resolution of a few kilometres.
CryoSat-2, to be launched in 2009, will carry a Ku band radar altimeter specially developed to measure ice. CryoSat-2 will achieve improved spatial resolution of 250 m. This compares with the ICESat laser footprint of 70 m.
In order to provide coverage of almost all the polar regions, CryoSat-2 will orbit at an unusually high inclination, reaching latitudes of 88 North and South. Other altimeters do not reach this far north or south. The altimeter on ENVISAT for example, only reaches 81.5 deg North.
Scatterometer
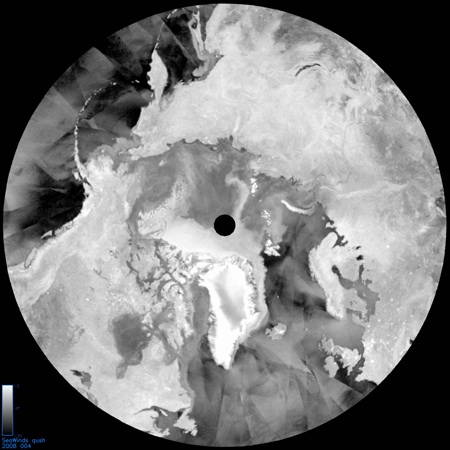
The scatterometer operates at oblique incidence. It measures the amount of energy scattered by a rough surface back in the direction of the sensor. A smooth surface will reflect the radar pulse away from the sensor. The scatterometer is a wide swath instrument - for example 1800 km for Quikscat, and a spatial resolution in the range 20 - 50 km.

Whilst the greatest contrast is between water and ice, ice age and snow cover also affect the surface roughness.
Scatterometers can provide complete, daily data about sea ice day and night, through cloud cover with about the same level of detail as passive microwave imagery. The SeaWinds sensor aboard NASAs Quick Scatterometer (QuikSCAT) satellite is a Ku band instrument and provides daily, global views of ocean winds and sea ice. The ASCAT scatterometer on the MEtop satellite is a C band instrument.
Imaging radar

Source: ESA
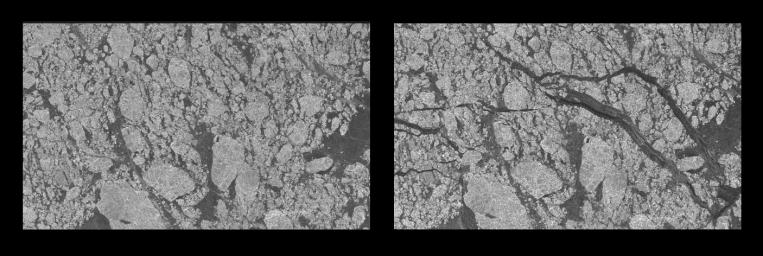
Synthetic aperture radar (SAR) is a type of imaging radar flown on satellites. It can give images with a resolution of 10 or 20 metres, but requires complex processing to achieve this. Like the scatterometer, the SAR operates at oblique incidence, and the highest return comes from rough surfaces.
Sea ice typically returns more of the radar energy emitted by the sensor than the surrounding ocean, which makes it easy to distinguish between the two. Ice type and snow cover affect the return signal, although it is not always easy to interpret the data. Young ice which still has brine between the ice crystals tends to have a lower return than multi-year ice. SAR can therefore provide information on the relative extent of thick vs. thin sea ice.
The fine resolution of SAR instruments means that even detect small leads in sea ice can be detected, and SAR data is used to help route ships through ice-covered regions. SAR imagery is particularly valuable for operational ice centres for example the National Ice Center and Canadian Ice Service, to learn more about their operational sea ice products.

ESA ENVISAT RA2/MWR Product Handbook

Cryosat-2
To learn more about Cryosat, visit ESA - Living Planet Programme - CryoSat.

Source: NASA/JPL/ASF, from the NASA JPL Photojournal.

Envisat ASAR mosaic of the Arctic Ocean for early September 2007, clearly showing the most direct route of the Northwest Passage open (orange line) and the Northeast passage only partially blocked (blue line). The dark grey colour represents the ice-free areas, while green represents areas with sea ice.
The mosaic was created from nearly 200 images.
Source: ESA
More about freeboard and how ice thickness can be measured on the next page

