4. Mass Tourism
Case study Tenerife (5/8)
Where do we meet Tourists on Tenerife?
From the previous page we already know, that Tenerife has got a favourable climate for tourism. But new hotels and touristic infrastructure are not found everywhere on the island. Why? Let's see where we can find the best suitable conditions of the island in the eye of a summer tourist.
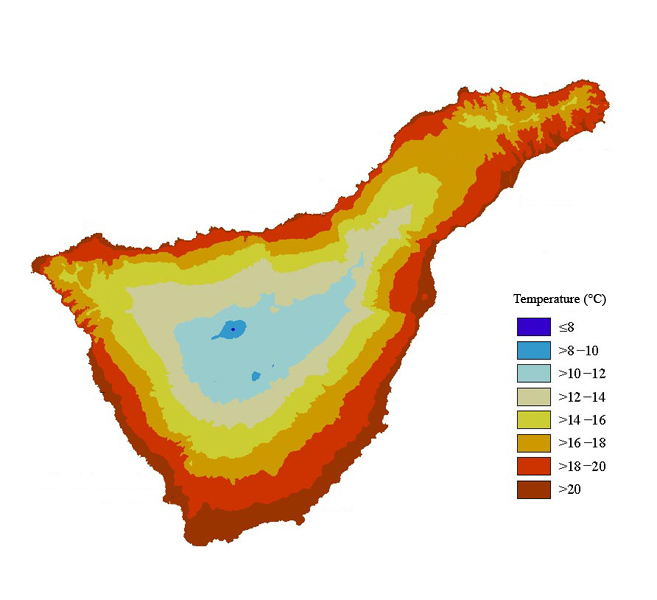
Fig. 1:
Temperature distribution on Tenerife.
Source: Naumann 2008 |
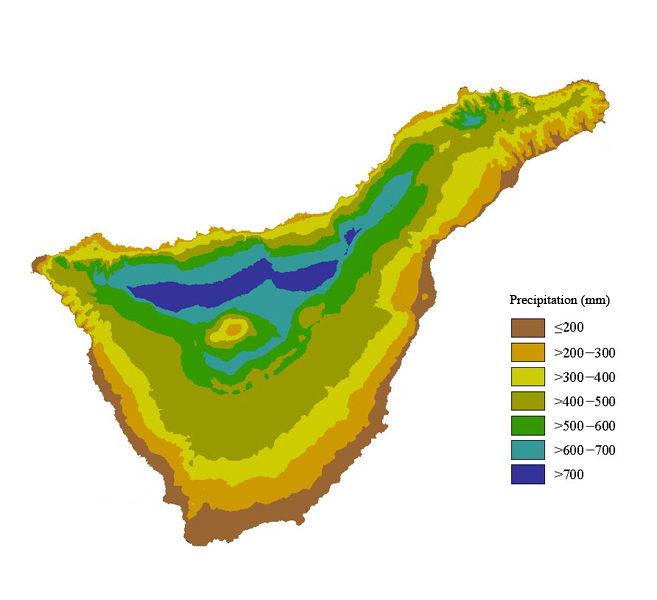
Fig. 2:
Percipitation distribution on Tenerife.
Source: Naumann 2008 |

Fig. 3:
Map of altitudinal zones on Tenerife.
Source: Naumann 2008 |
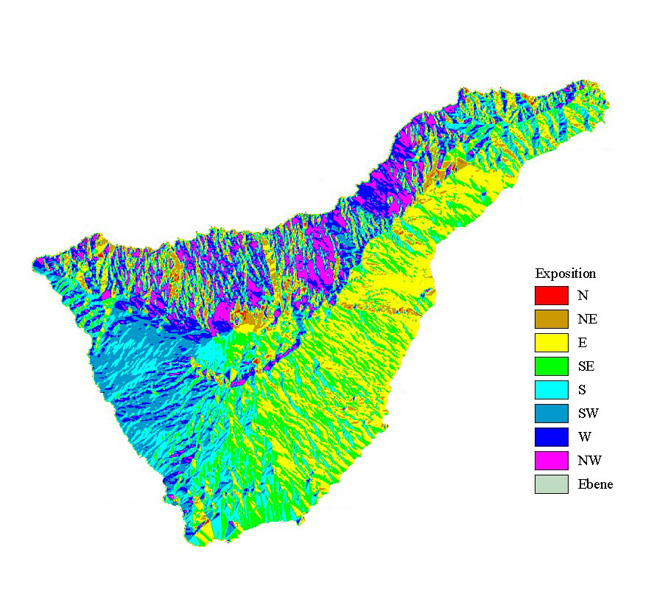
Fig. 4:
Map of exposition on Tenerife.
Source: Naumann 2008 |
Hints to the maps: The map of temperature distribution in figure 1 depicts the monthly mean temperatures. Figure 2 shows the total amount of annual precipitation and its distribution. The altitudinal zones in figure 3 are extracted from a digital terrain model. Figure 4 shows the slope exposition on Tenerife.
Tasks: 1.
Where are the ideal conditions for tourism? Consider
the temperature and precipitation distribution, the
altitudinal zones, the exposition of the island and the true-color satellite image.
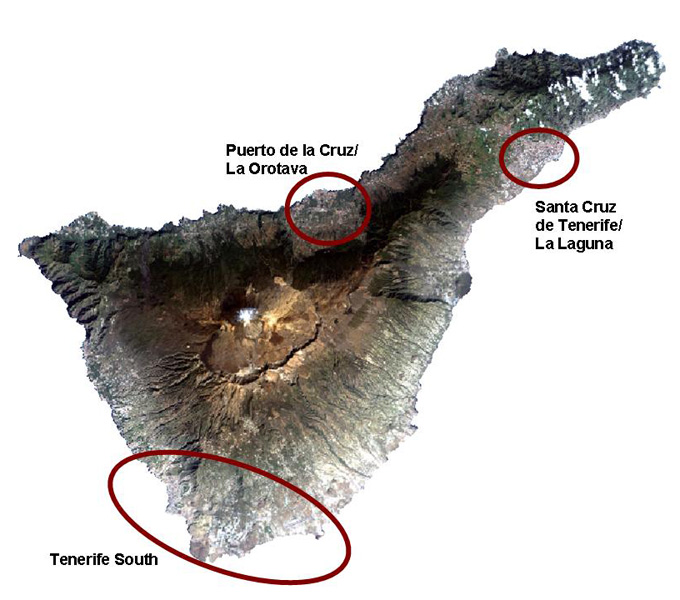
2. Find with the help of the four maps and the satellite image
a maximum three regions on the island, where tourism is booming. In addition you can use the film and figure on page 1.
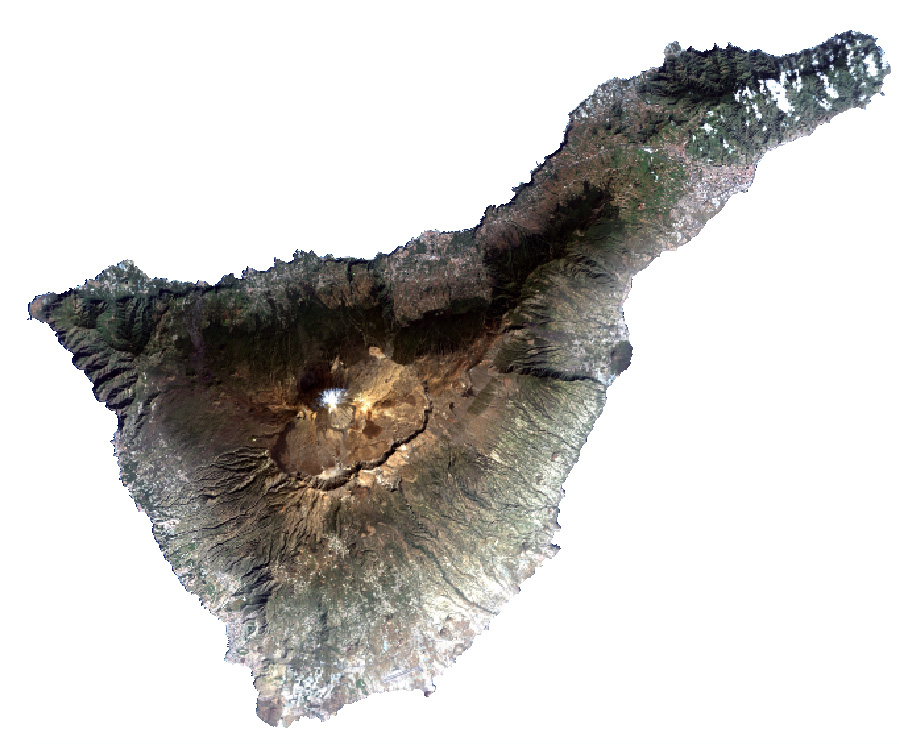
Source: Landsat
Additional information: Advertising for a holiday on Tenerife. Do you feel attracted?